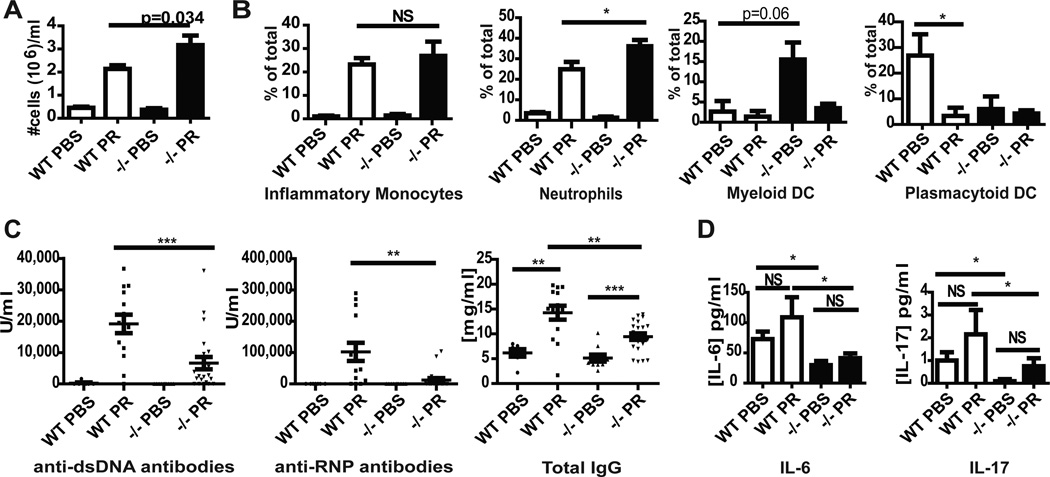
Figure 1.
Balb/c Caspase-1 −/− mice have intact peritoneal inflammatory responses to pristane injection but display decreased autoantibody, inflammatory cytokine and chemokine synthesis. A and B. Wild-type (WT) (n=4 PBS, n=10 pristane) and Caspase-1 −/− (n=5 PBS, n=11 pristane) peritoneal fluid was harvested 2 weeks post pristane or PBS injection. A. Total cell numbers were counted and are plotted as mean+SEM cell number per ml of peritoneal fluid removed. B. Cell populations were quantified by flow cytometry and are expressed as percentage of the total cell population when 1x10⁶ total cells are examined. C. Results represent quantification of antibody titers by ELISA of sera from wild-type (WT) Balb/c or Balb/c caspase-1 −/− mice six months post exposure to PBS or pristane. Each dot represents a single mouse and mean +/− SEM is plotted. PBS WT n=6, PBS −/− n=11, Pristane WT n=13, Pristane −/− n=24. D. Plasma cytokine and chemokine concentrations from mice described in (C) were quantified on undiluted samples using Milliplex. Bars represent the mean +SEM. PBS WT n=6, PBS −/− n=11, Pristane WT n=13, Pristane −/− n=24. *=p<0.05, **=p<0.01, ***=p<0.001. PR=pristane

