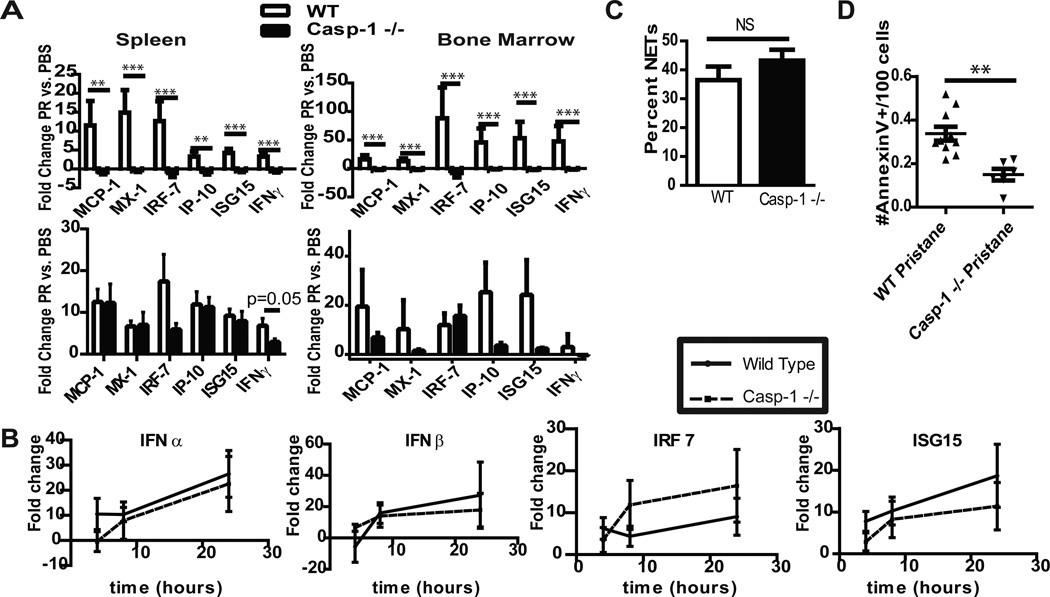
Figure 2.
Type I IFN signature induced after pristane exposure is abrogated in caspase-1 −/− mice. A. Bars represent mean fold-change +SEM mRNA of type I IFN regulated genes in splenocytes and bone marrow mononuclear cells isolated from Balb/c mice 6 months (top) or 2 weeks (bottom) after treatment. Following normalization to β-actin, comparisons of δ-CT were made for pristane versus PBS-treated mice. PBS WT n=7, PBS −/− n=11, Pristane WT n=14, Pristane −/− n=24. B. WT Balb/c or caspase-1 −/− (n=5 each) splenocytes from 10 week-old mice were stimulated with R848 for varying time points. Quantification of mRNA of type I IFN-regulated genes was performed as in 2A. C. Bone marrow neutrophils were isolated from WT or caspase-1 −/− mice (n=4 each) and stimulated overnight with 40nM PMA. NETs were detected by extracellular colocalization of anti-elastase and Hoechst. Graph represents mean +SEM of percent of NETs calculated as number of NETting cells/total number of cells. D. Two weeks following pristane injection, peritoneal inflammatory cells were isolated, stained with Annexin-V and analyzed via flow cytometry. Graph demonstrates # apoptotic/pyroptotic cells/100 cells in the live cell gate for each mouse (WT n=10, caspase-1 −/−, n=6). **=p<0.01, ***=p<0.001.

