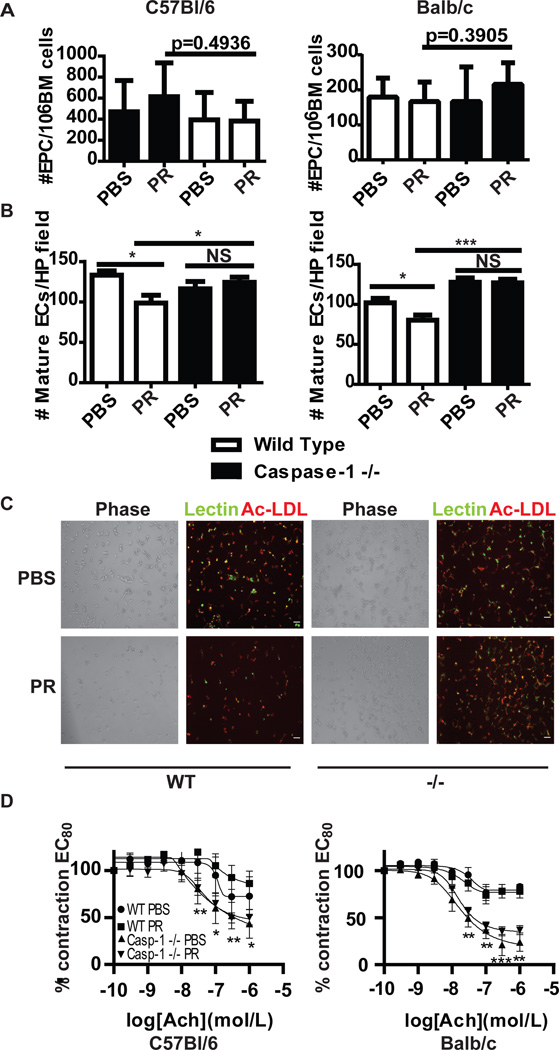
Figure 3.
EPC differentiation and endothelial-dependent vasorelaxation increase in the absence of caspase-1. A. Bone marrow from (left) C57BL/6 WT (n=5 PBS, n=8 pristane) or C57BL/6 caspase-1 −/− mice (n=10 PBS, n=14 pristane) or (right) Balb/c WT (n=7 PBS, n=14 pristane) or Balb/c caspase-1 −/− (n=11 PBS, n=24 pristane) mice was isolated and EPCs were quantified by flow cytometry. Results represent the mean+SEM of EPCs/ml of blood for each group. B. Bars represent number of mature endothelial cells (ECs)/high power field quantified by fluorescent microscopy 7 days after plating bone marrow cells under proangiogenic conditions. Left figure represents C57BL/6 WT (n=5 PBS, n=8 pristane) compared to C57BL/6 caspase-1 −/− mice (n=10 PBS, n=14 pristane). Right figure represents Balb/c WT (n=7 PBS, n=14 pristane) versus Balb/c caspase-1 −/− (n=11 PBS, n=24 pristane) mice. C. Representative photomicrograph of EC cultures as in B. D. Following establishment of maximal contraction, endothelium-dependent vasorelaxation of aortic rings was quantified following exposure to graded concentrations of Acetylcholine (Ach) to 80% contracted aortic rings. p values represent comparisons between WT and caspase-1 −/− mice. n=3 PBS WT, 6 PBS pristane, 11 PBS casp-1 −/− and 23 pristane casp-1 −/−. *=p<0.05, **=p<0.01, ***=p<0.001.

