Figure 4.
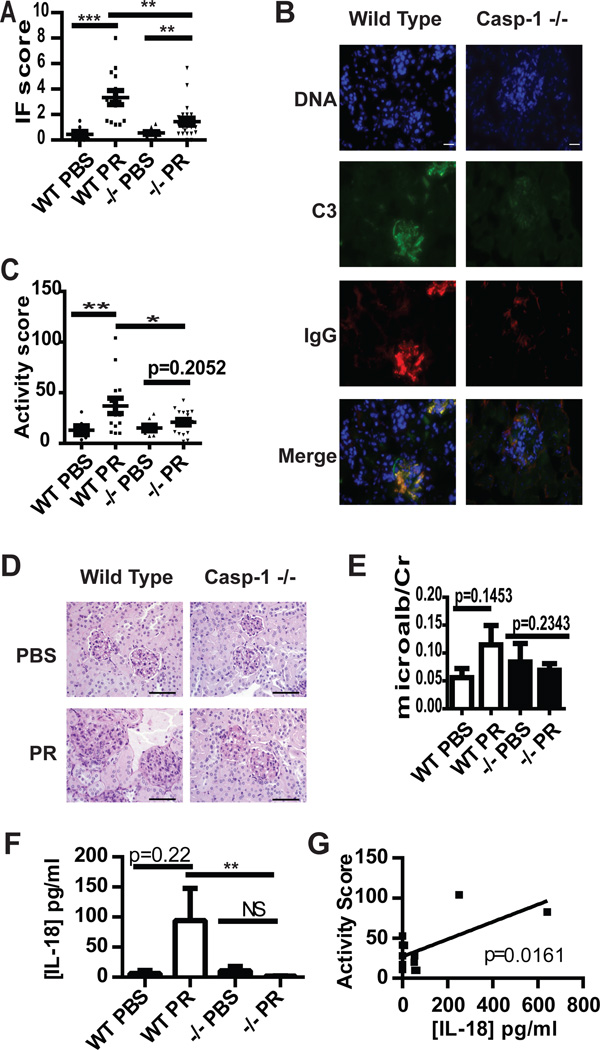
Caspase-1 modulates immune complex deposition and glomerular activity scores in lupus-prone mice. A and B. Deposition of C3 (green) and IgG (red) was quantified in kidneys obtained from WT Balb/c or caspase-1 −/− mice following PBS or pristane exposure. Composite scores were averaged (A) and representative photomicrographs are shown in B. Each kidney is represented on the graph and the mean+/−SEM is displayed. PBS WT n=7, PBS −/− n=11, Pristane WT n=14, Pristane −/− n=23. Scale bar=20µm. C and D. Glomerular inflammation activity scores were determined on PAS-stained formalin-fixed kidney sections from WT or caspase-1−/− mice exposed to PBS or pristane and displayed as in A. Representative photomicrographs (D) demonstrate enlarged, hypercellular glomeruli in pristane WT mice, but not in caspase-1 −/− mice, due to mesangial and endocapillary inflammation. WT PBS n=6, PBS −/− n=8, Pristane WT n=14, Pristane −/− n=19. Scale bars=100µm. E. Microalbumin:creatinine ratios were determined on urine collected at the time of euthanasia. n=as in A. F. [IL-18] was determined by ELISA on serum collected 5 months post PBS or pristane treatment. n= as in A. G. Linear regression of [IL-18] vs. renal activity score in pristane treated WT mice (n=12). *=p<0.05, **=p<0.01, ***=p<0.001. PR=pristane.

