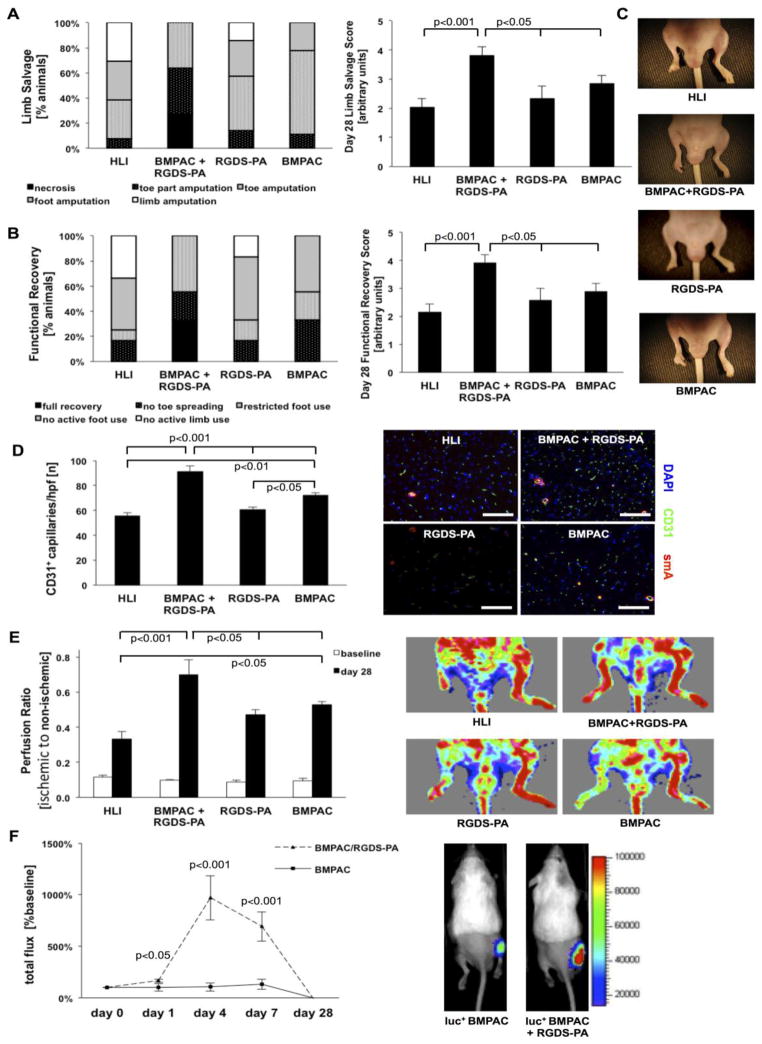
Figure 5.
In vivo evaluation of BMPACs delivered with RGDS-PA. (A) The percentage of mice with various grades of necrosis, along with the overall limb salvage score for each group at day 28. (B) The percentage of mice with various grades of motor function, along with the overall motor function score for each group at day 28. (C) Example gross observations of ischemia and necrosis at day 28. (D) Quantification of CD31+ capillaries per high powered field and representative images of CD31 and smooth muscle actin staining (n=5–9/group) with scale bars for micrographs indicating 100 μm. (E) Laser Doppler perfusion ratio (ischemic to non-ischemic limb perfusion) and representative LDPI images from each group (n=7–13/group). (F) Measurement of bioluminescence in mice injected with β-actin-luc+ BMPACs with and without RGDS PA, expressed as total flux in comparison to baseline, along with representative bioluminescence images at day 7 (n=4–10/group/timepoint).

