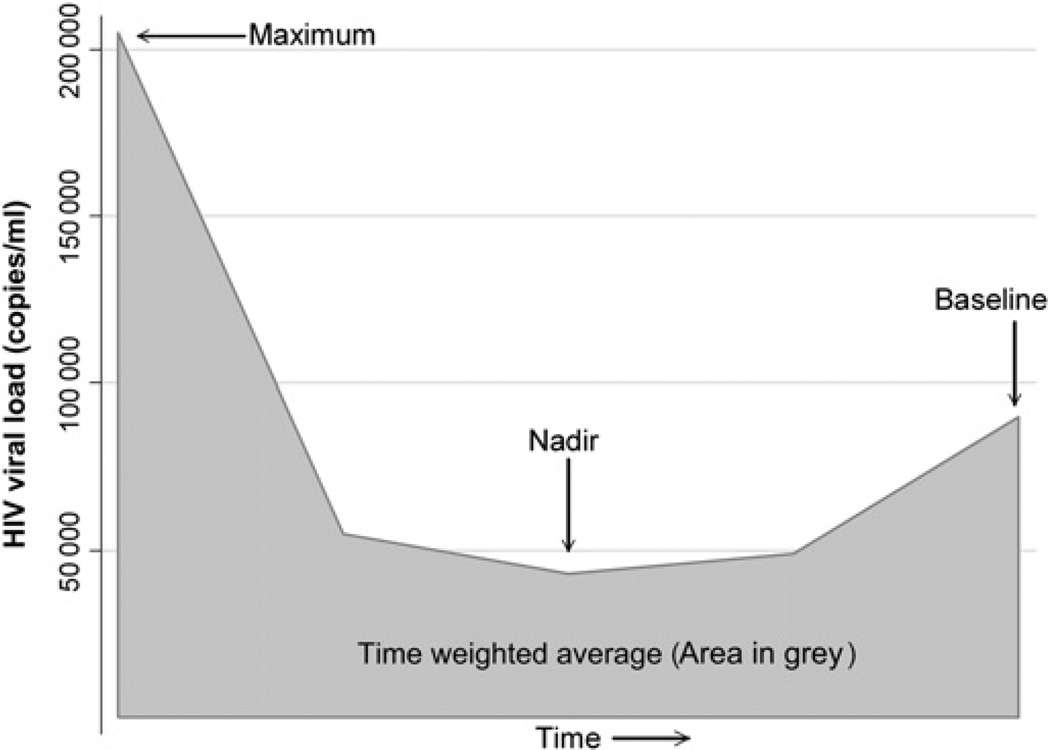
Figure 1.
Idealised graph of viral load measurements. For analysis, the baseline HIV CD4 and viral load (obtained at the time of spirometry) were used. Additional measures from retrospective longitudinal data were used to determine the nadir, maximum and time-weighted average (calculated by the area under the curve in grey) over duration of follow-up.

