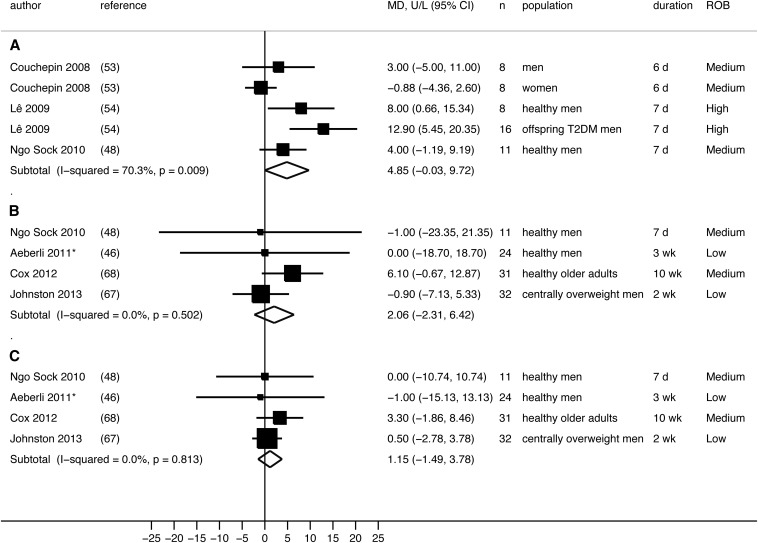
FIGURE 4.
Random-effects meta-analysis of RCTs reporting liver enzyme outcomes. A: Hypercaloric fructose compared with WM diet: ALT outcome. B: Hypercaloric fructose compared with glucose: ALT outcome. C: Hypercaloric fructose compared with glucose: AST outcome. Each black box represents the individual study's effect estimate, and the horizontal line represents the 95% CI of the effect estimate. Within each panel, the diamond shape represents the meta-analysis pooled effect estimate and its CI. *Because the same 24 men were randomly assigned to receive 2 different doses of fructose or glucose, only results from one dose can be included in the meta-analysis. Results from 80 g fructose/d compared with glucose diets were included in the current meta-analysis. The use of results from 40 g fructose/d compared with glucose diets produced similar pooled-effect estimates. ALT, alanine aminotransferase; AST, aspartate aminotransferase; MD, mean difference between groups; ROB, risk of bias; T2DM, type 2 diabetes; WM, weight maintenance.

