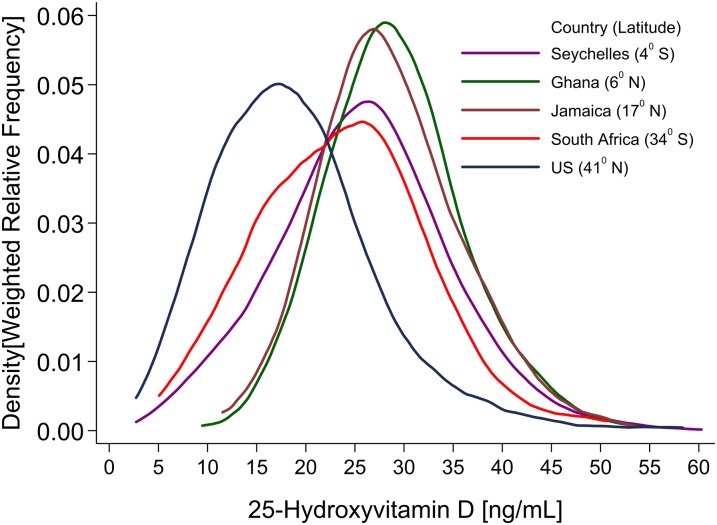
FIGURE 2.
Frequency distribution of total serum BMI-adjusted 25-hydroxyvitamin D concentrations in the 5 study population samples from the Vitamin D Ancillary Study. The sample consisted of 497, 502, 459, 497, and 494 participants from the United States, South Africa, Jamaica, Ghana, and Seychelles, respectively.

