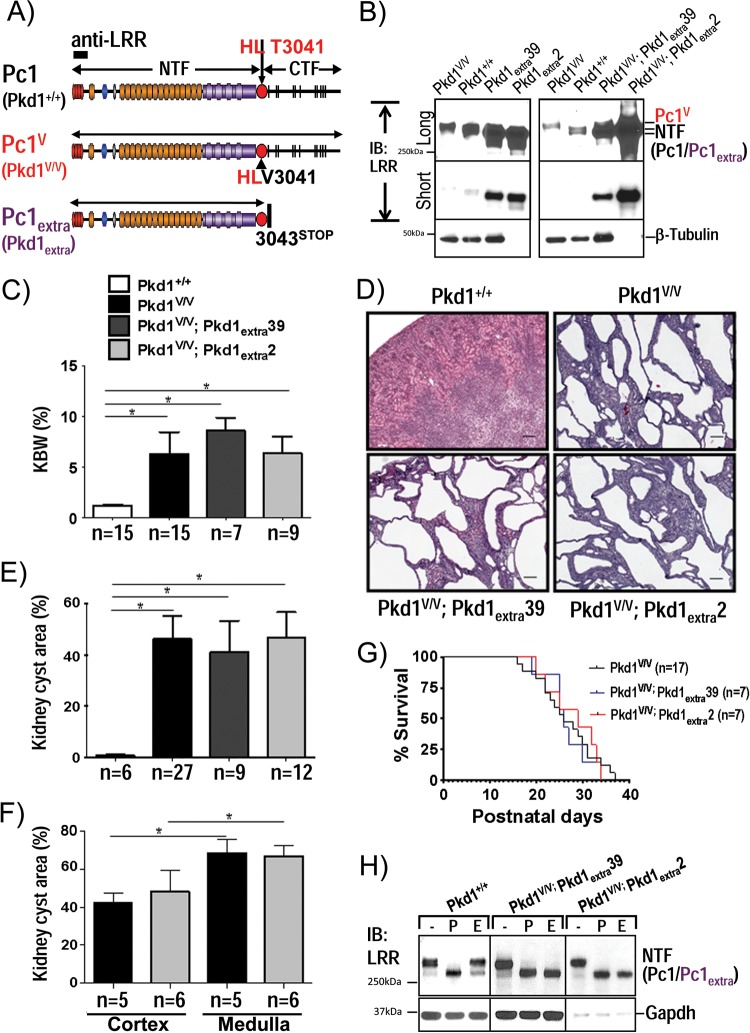
FIG 5.
Analysis of Pc1deN functional role by a Pc1extra-BAC transgene in Pkd1V/V mice. (A) Schematic structure of endogenous Pc1 (Pkd1+/+), Pc1V (Pkd1V/V), and Pc1extra (Pkd1extra) proteins. Pc1extra protein was generated by insertion of a termination translation codon in exon 25 of Pkd1 at aa 3043 immediately following the GPS cleavage site. The epitope recognized by anti-LRR is indicated as a black box. (B) Pc1/Pc1V/Pc1extra protein expression levels in P10 kidneys were analyzed by IB with anti-LRR from mice with the genotypes indicated. Protein loading for Pkd1extra2 and Pkd1V/V; Pkd1extra2 mice was decreased by 10-fold (0.9 μg/lane) relative to all other kidney samples (9 μg). Pc1extra exhibits higher expression levels in line Pkd1extra2 than in line Pkd1extra39 and appears in both lines as a single band in comparison to the doublet detected in the wild-type Pc1. β-Tubulin was used as a loading control. (C) Histogram of the kidney weight-to-body weight ratio (KBW) for all genotypes as indicated. The ratios for the Pkd1V/V; Pkd1extra39, Pkd1V/V; Pkd1extra 2, and Pkd1V/V mice at P10 were significantly increased in comparison to the value for WT mice (*, P < 0.0001). n, number of mice. (D) Histopathological analysis (H&E staining) of Pkd1V/V; Pkd1extra kidneys at P10. Pkd1V/V; Pkd1extra39 and Pkd1V/V; Pkd1extra2 mice displayed numerous cysts throughout the kidney parenchyma comparable to Pkd1V/V mice. Scale bar, 100 μm. (E) Histogram of renal cystic index of Pkd1V/V; Pkd1extra kidneys at P10. Cystic involvement (percentage of cystic area) in the Pkd1V/V; Pkd1extra39 and Pkd1V/V; Pkd1extra2 lines shows no significant difference from that in the Pkd1V/V kidneys, but values were highly significant compare to control values (*, P < 0.0001). n, number of mice. (F) Renal cystic involvement in medulla versus cortex in Pkd1V/V and Pkd1V/V; Pkd1extra2 mouse lines at P10. For both Pkd1V/V and Pkd1V/V; Pkd1extra2 mouse lines, cyst surface area (%) is significantly higher in the medulla than in cortex (*, P < 0.0003). Values for the Pkd1V/V; Pkd1extra2 line are not significantly different from those of Pkd1V/V mice in cortex or medulla. n, number of mice. (G) Kaplan-Meier survival curves of the Pkd1V/V, Pkd1V/V; Pkd1extra39, and Pkd1V/V; Pkd1extra2 mice revealed similar life expectancies. (H) Pc1/Pc1V/Pc1extra N-glycosylation status at P10 kidneys was analyzed by IB with anti-LRR on kidney lysates from control Pkd1+/+, Pkd1V/V; Pkd1extra39, and Pkd1V/V; Pkd1extra2 mice, either untreated (−) or deglycosylated with PNGase F (P) or endo-H (E). Pc1 NTF in WT kidneys displayed both Pc1 endo-H-resistant and -sensitive forms, whereas Pc1extra in Pkd1V/V; Pkd1extra39 and Pkd1V/V; Pkd1extra2 kidneys is mainly endo-H sensitive. Protein loading for Pkd1V/V; Pkd1extra2 mice was decreased by 10-fold in comparison to other kidney samples. GAPDH served as a loading control.

