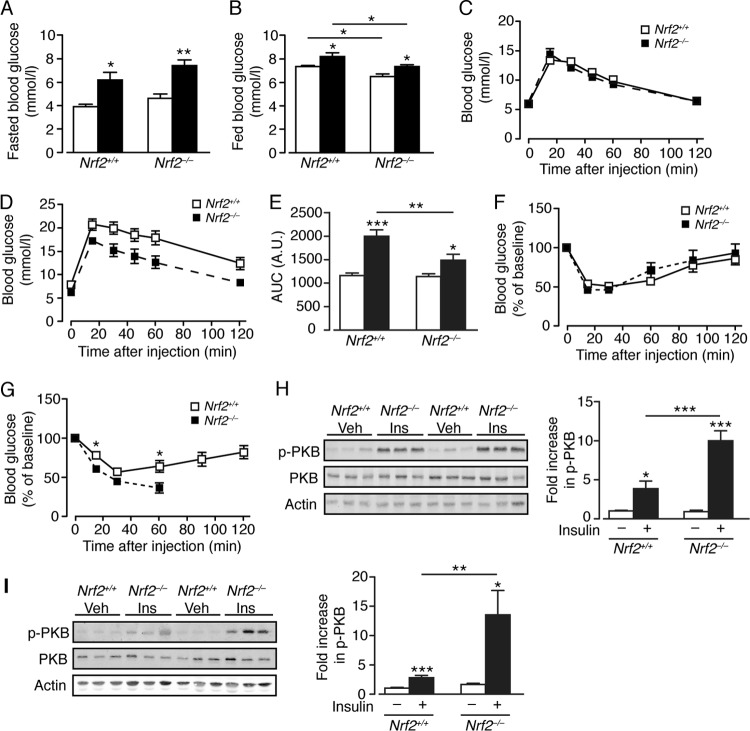
FIG 2.
Nrf2−/− mice display improved glucose homeostasis and insulin sensitivity with enhanced skeletal muscle and liver insulin signaling. (A and B) Fasted (A) and fed (B) blood glucose levels in Nrf2+/+ and Nrf2−/− mice after 16 weeks on an RC or HF diet (5 or 6 mice per group). (C) GTT on Nrf2+/+ (n = 11) and Nrf2−/− (n = 9) mice, 28 weeks old, fed RC. (D) GTT on Nrf2+/+ and Nrf2−/− mice fed an HF diet for 20 weeks from 8 weeks of age (11 mice per group). (E) Quantification of the area under the curve (AUC) for the total glycemic excursions shown in panels C and D by genotype and diet. (F) ITT on Nrf2+/+ (n = 11) and Nrf2−/− (n = 9) mice, 28 weeks old, fed RC. (G) ITT on Nrf2+/+ (n = 11) and Nrf2−/− (n = 10) mice fed an HF diet for 20 weeks from 8 weeks of age. Note the curtailed time course of tolerance tests on Nrf2−/− mice owing to continual decline in blood glucose and the requirement to intervene with glucose administration. (H and I) Representative immunoblots of total PKB and insulin-stimulated phosphorylation of PKB (also called Akt) at Ser473 (p-PKB) from the liver (H) and skeletal muscle (I) of Nrf2+/+ and Nrf2−/− mice (7 months old) fed RC (10 to 19 mice per group). Quantification of the immunoblot data is shown, and in each case, p-PKB/PKB was normalized with respect to RC-fed Nrf2+/+ levels. White bars, RC fed; black bars, HF fed. The results are means and SEM. *, P < 0.05; **, P < 0.01; ***, P < 0.001.

