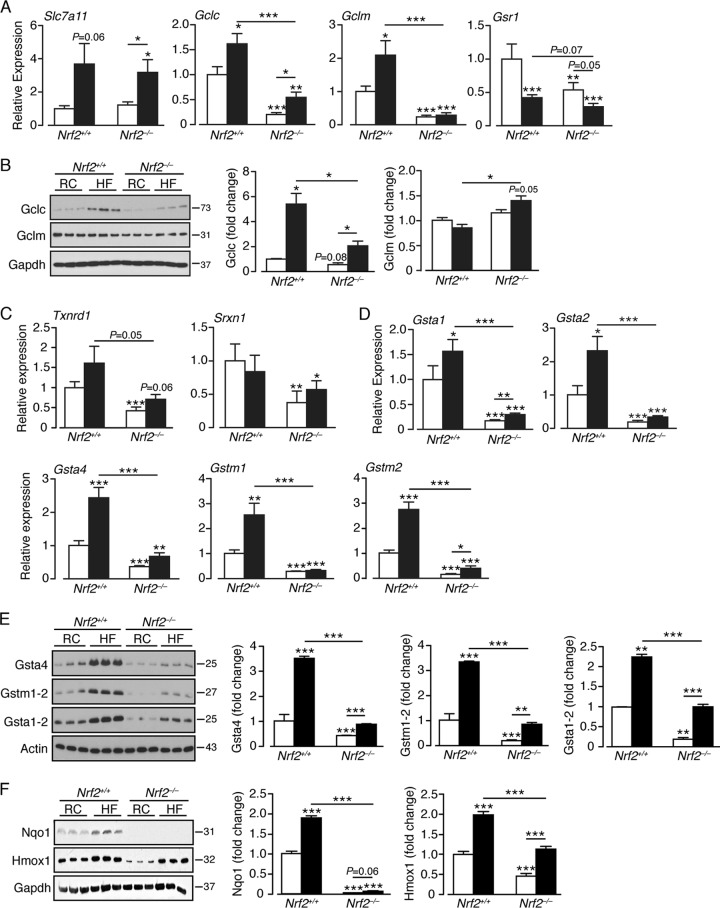
FIG 9.
A high-fat diet stimulates an antioxidant response in Nrf2+/+ livers that is attenuated in Nrf2−/− livers. (A) Quantitative-PCR analysis of mRNAs for glutathione homeostasis genes in livers of Nrf2+/+ and Nrf2−/− mice on an RC or HF diet (7 to 12 mice per group). (B) Representative immunoblots of Gclc and Gclm proteins in livers of Nrf2+/+ and Nrf2−/− mice on an RC or HF diet. Quantification of the immunoblot data for each protein is shown by genotype and diet (3 mice per group). (C) Quantitative PCR of mRNAs for Txnrd1 and Srxn1 in livers of Nrf2+/+ and Nrf2−/− mice on an RC or HF diet. (D) Quantitative PCR of mRNA for “prototypic” ARE-driven genes from livers of Nrf2+/+ and Nrf2−/− mice on an RC or HF diet (10 to 12 mice per group). (E) Representative immunoblots of Gsta4, Gstm1-2, and Gsta1-2 in livers of Nrf2+/+ and Nrf2−/− mice on an RC or HF diet. Quantification of the immunoblot data for each protein is shown by genotype and diet (3 mice per group). (F) Representative immunoblots of Nqo1 and Hmox1 in livers of Nrf2+/+ and Nrf2−/− mice on an RC or HF diet. Quantification of the immunoblot data for each protein is shown by genotype and diet (6 mice per group). In each case, the data were normalized with respect to RC-fed Nrf2+/+ levels for each protein or gene. White bars, RC fed; black bars, HF fed. The results are means and SEM. *, P < 0.05; **, P < 0.01; ***, P < 0.001. Molecular mass markers (B, E, and F) are in kDa.

