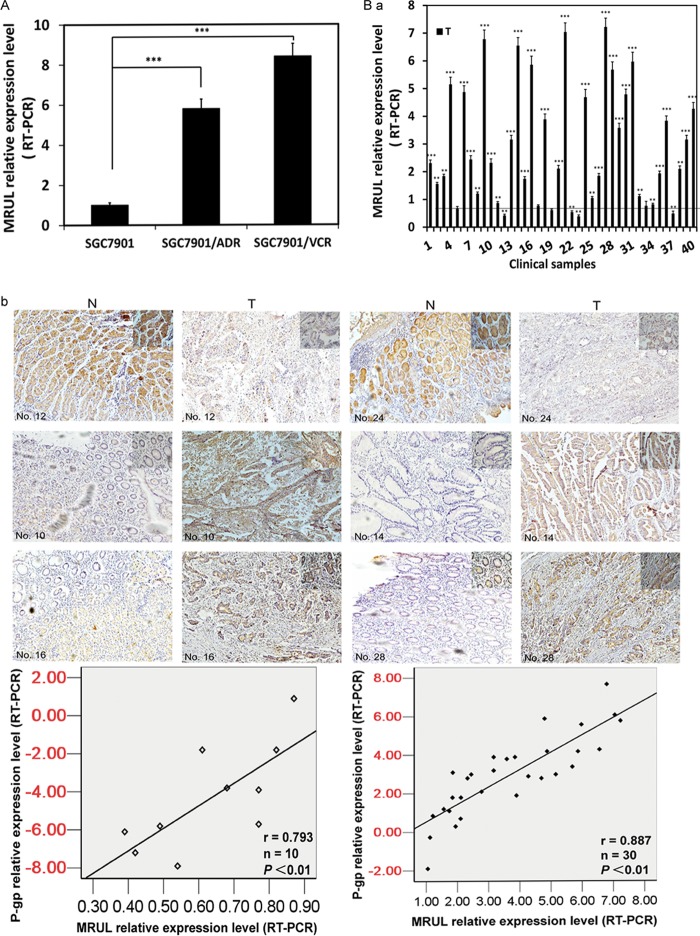
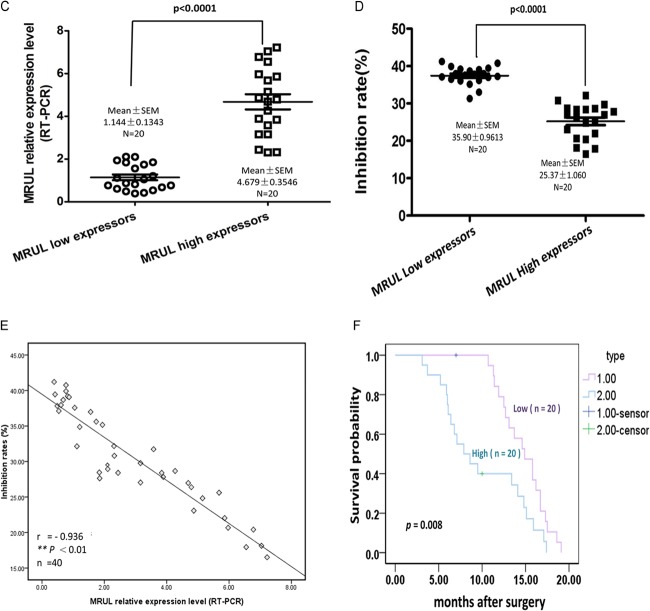
FIG 2.
lncRNA MRUL expression levels showed a negative linear correlation with chemosensitivity to gastric cancer (GC) cell lines and tissue specimens. (A) MRUL relative expression levels in SGC7901/VCR, SGC7901/ADR, and SGC7901 cells. (B-a) MRUL relative expression levels of clinical samples compared with those of paired noncancerous tissues. (B-b) P-gp expression of 40 primary GC tissues and paired noncancerous tissues. Relative IHC scores of P-gp were positively correlated with MRUL expression levels. T, tumor; N, normal. (C) Forty GC tissues were divided into MRUL high-expressor and low-expressor groups according to the fold change median. (D) Inhibition rates of MRUL high- and low-expressor groups. (E) Negative correlation between inhibition rates and MRUL expression levels. (F) Patient life spans in MRUL low- and high-expressor groups. Data represent means plus standard deviations of three replicates (***, P < 0.001; **, P < 0.01).


