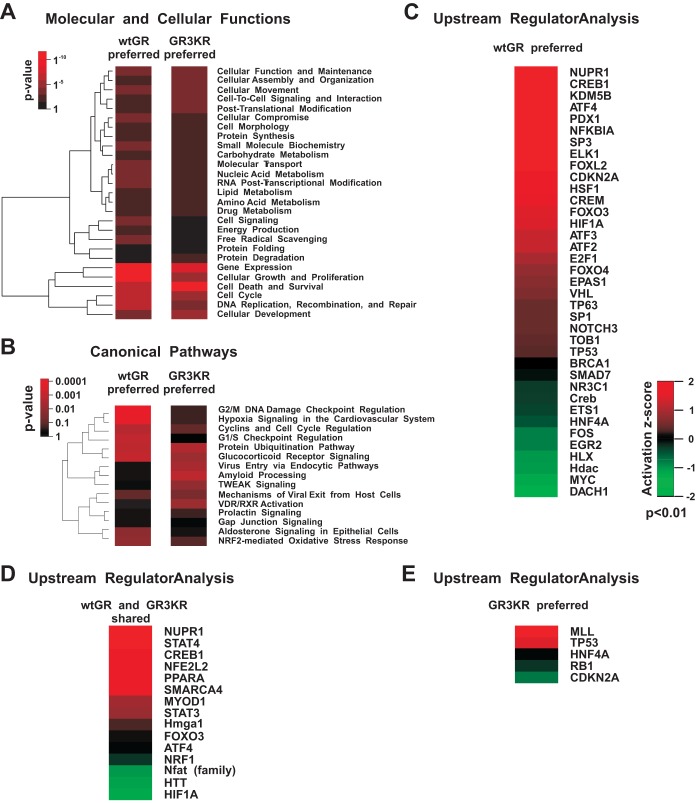
FIG 5.
Ingenuity pathway analysis of genes affected by 15d-PGJ2 preferentially in the wtGR- or the GR3KR-expressing HEK293 cells. (A) Heat map showing unsupervised hierarchical clustering of the most significantly enriched molecular and cellular functions affected by 15d-PGJ2 exposure. The color key indicates the P value of the enrichment, where black depicts no enrichment and bright red depicts high enrichment. (B) Heat map showing unsupervised hierarchical clustering of the most significantly enriched canonical pathways affected by 15d-PGJ2 exposure. RXR, retinoid X receptor; TWEAK, TNF-related weak inducer of apoptosis; VDR, vitamin D receptor. (C to E) Heat maps (based on upstream regulator IPA) showing transcription factors that were influenced by 15d-PGJ2 (P < 0.01). The color key indicates the activation z-score, where values > 0 indicate activation and values < 0 indicate inhibition of a particular transcription factor by 15d-PGJ2 treatment.

