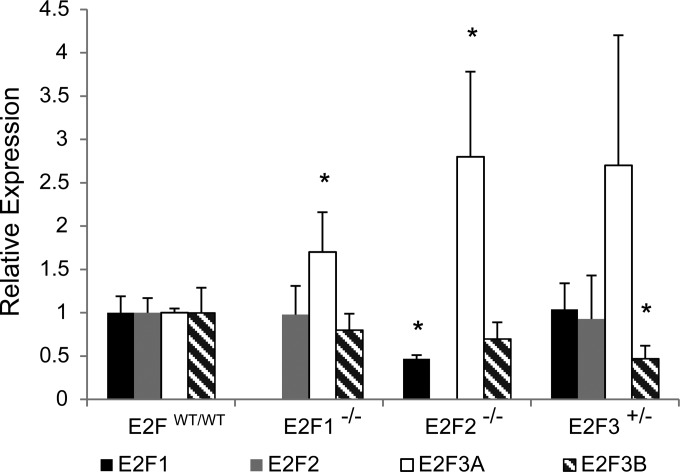
FIG 3.
E2F loss results in changes in the expression of the genes of other E2F family members. Shown are quantitative PCR results for the relative expression of E2F1, E2F2, E2F3A, and E2F3B in E2FWT/WT, E2F1−/−, E2F2−/−, and E2F3+/− tumors (n, 4 for each genotype). E2F1−/− tumors had upregulation of E2F3A (P, 0.0232). In E2F2−/− tumors, a decrease in E2F1 levels (P, 0.0016) and significant upregulation of E2F3A (P, 0.0105) were observed. In E2F3+/− tumors, significant downregulation of E2F3B (P, 0.0175) was observed.

