FIG 9.
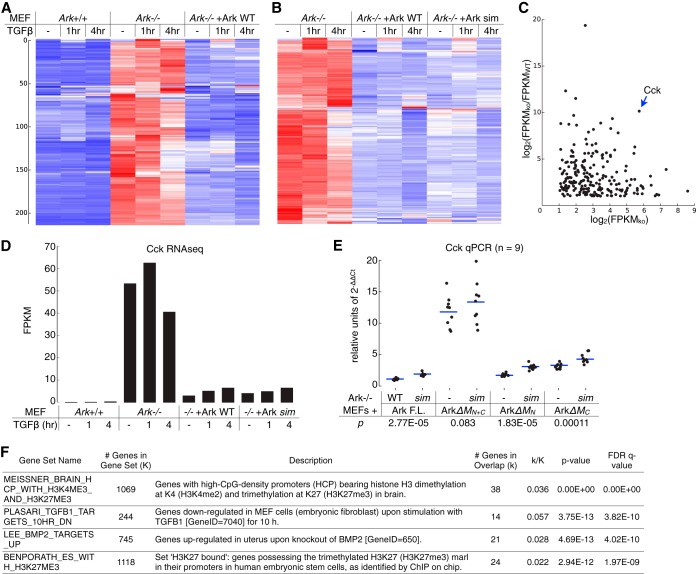
Arkadia-mediated transcriptional repression. (A and B) Profiles of Arkadia-mediated transcriptional suppression in Ark+/+, Ark−/−, and arkadia-reconstituted MEFs were obtained through RNA sequencing. The heat maps illustrate the results of two separate hierarchical clustering analyses using the same list of 213 genes that exhibited an expression level of ≥2 FPKM in Ark−/− MEFs and at least 50% repression in both Ark+/+ and Arkadia-reconstituted Ark−/− MEFs (as indicated). Each clustering was calculated based on the standardized FPKM values (z-scores), scaled for each gene. Heat maps are shown on a blue-white-red color scale corresponding to the z-score, as described in the legend to Fig. 2. The sorted lists of genes after each hierarchical clustering are presented as separate panels in Table S2 in the supplemental material. (C to E) Cholecystokinin (Cck) is a major Arkadia-suppressed gene in MEFs. (C) Based on RNA-seq results for the 213 selected genes in no-TGFβ samples, a log2-scaled scatter plot illustrates the degree of Arkadia-mediated suppression (FPKMKO/FPKMWT ratio, where FPKMKO is the expression level in Ark−/− MEFs and FPKMWT is the expression level in Ark+/+ MEFs) for each with respect to FPKMKO. (D) The FPKM values for the Cck gene in all samples are shown as a bar graph. (E) Additional expression analysis of Cck using RT-qPCR was carried out in Ark−/− MEFs reexpressing various Arkadia proteins (as indicated). The qPCR results were calculated based on the expression levels of Cck relative to that of Gapdh; results from multiple independent qPCR assays were plotted as dots slightly scattered along the x axis for an ensemble view of all data points and with their mean values highlighted by horizontal lines (E). The significance (P value) of the difference between the activity of an Arkadia protein and its corresponding sim mutant was estimated based on a paired, one-tailed Student's t test. (F) Overlaps between the Arkadia-suppressed genes and gene sets in Molecular Signatures Database (MSigDB). The query returned the top 20 gene sets showing significant overlaps (P < 6e−12). The 4 gene sets presented indicate the enrichment for genes with histone H3K27 trimethylation or genes downregulated by the TGFβ pathway. The complete results are shown as a panel in Table S2 in the supplemental material. FDR, false discovery rate; q value, minimum FDR at which the test was significant.

