FIG 2.
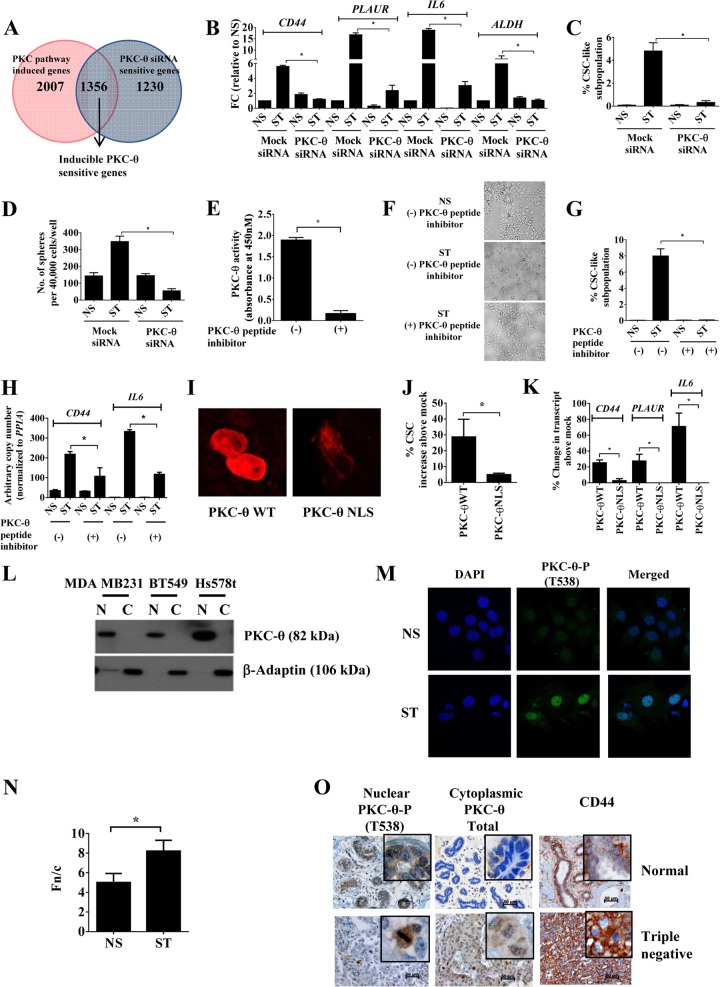
Nuclear PKC-θ is required for the induction of key EMT and CSC signature genes. (A) Venn diagram of microarray analysis depicting “inducible PKC-θ-sensitive gene cluster” by comparison of “PKC pathway induced genes” with “PKC-θ siRNA-sensitive genes.” Genes with a log2 (0.5)-fold difference were considered induced. (B) mRNA expression by real-time PCR in MCF-IM following transfection with either mock siRNA or PKC-θ siRNA and subsequently either nonstimulated (NS) or PMA stimulated (ST) for 60 h. mRNA expression changes are presented as fold changes (FC) relative to NS. (C) FACS analysis of CD44high/CD24low CSCs as described for panel B. (D) Mammosphere assay of mRNA under conditions as described for panel B. (E) PKC enzyme-linked immunosorbent assay (ELISA)-based kinase assays for PKC-θ peptide inhibitor. Relative kinase activity was calculated after subtracting blank wells. (F) Phase-contrast microscopy images of MCF-7 cells captured with either pretreatment with vehicle control (−) or PKC-θ-specific peptide (+) and subsequently nonstimulated (NS) or PMA stimulated (ST). (G) CD44high/CD24low CSC FACS analysis of samples as described for panel F. (H) mRNA expression by real-time PCR of CD44 and IL-6 as described for panel F. (I) Fluorescence microscopy images of MCF-7 cells following overexpression of PKC-θ WT (wild type) or PKC-θ NLS. (J) CD44high/CD24low CSCs FACS analysis of samples as described for panel H. Data are plotted as percent CSC increase above results for mock-treated samples. (K) mRNA expression by real-time PCR of samples as described for panel H. Data are plotted as percent change in transcript above results for mock-treated samples. (L) Immunoblotting for PKC-θ in cytoplasmic (C) and nuclear (N) fractions of indicated human breast cancer cell lines. (M) Confocal microscopy of MCF-IM with PKC-θ-P (phospho-T538) antibody (green) and nuclei stained with DAPI (blue). (N) Ratio of nuclear to cytoplasmic fluorescence (Fn/c) values for confocal microscopy images of MCF-IM as described for panel M. Image analysis was performed on confocal laser scanning microscopy (CLSM) files to determine Fn/c after subtraction of the fluorescence due to background. (O) Photomicrographs of nuclear and cytoplasmic staining of normal and triple negative invasive human breast cancer tissues using antibodies as above. All results represent either the means ± the standard errors from three independent experiments or, for panels F, I, L, M, and O, the individual results from a representative experiment of three replicates (n = 3). *, P < 0.05.

