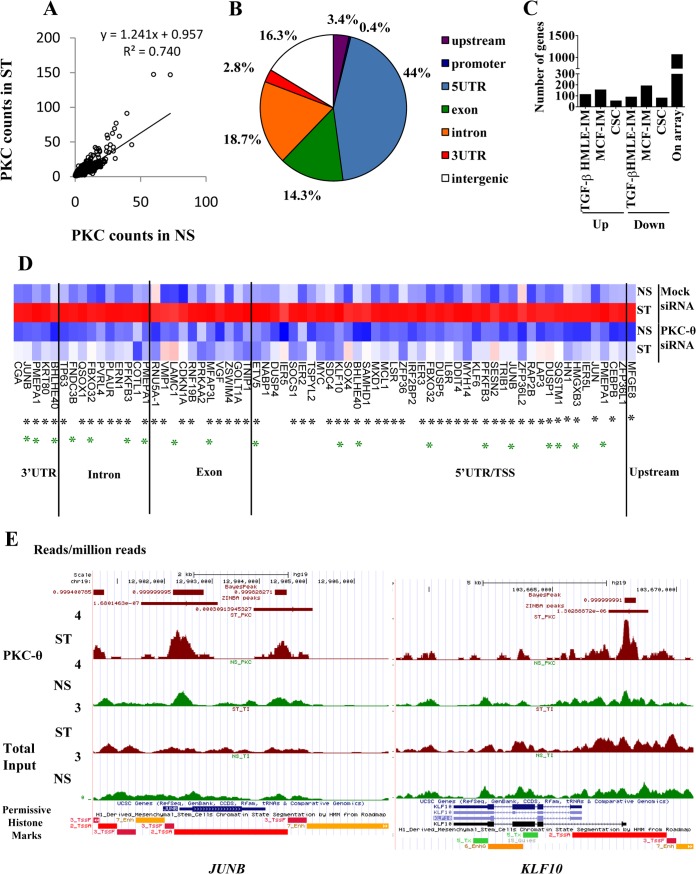
FIG 8.
Genome-wide analysis identifies the direct tethering of PKC-θ to a distinct cohort of inducible PKC-θ-sensitive genes. (A) PKC-θ binding in NS and ST MCF-7 cells as measured by normalized tag counts for the PKC peaks. Tag counts were normalized to per million uniquely mapped reads. The regression line is shown. (B) PKC-θ peaks associated with stimulated MCF7 cells bind different regions of the genome relative to the transcription start site (TSS) of the nearest Ensembl transcript. Peaks were classified as 5′UTR, 3′UTR, exon, intron, promoter (<1 kb from TSS), upstream (<10 kb from TSS), or intergenic. Only peaks with >1.5-fold normalized sequencing reads in the stimulated MCF7 sample were considered. (C) Numbers of PKC-θ bound genes that displayed increased or decreased abundance by TGF-β treatment of HMLE cells, PMA treatment of MCF-7 cells, or CSCs compared to NCSCs. Genes in which expression went up or down were determined using Hugene 1.0 Affymetrix microarrays with a log2 (0.5) cutoff. (D) Expression of the PKC-dependent genes with PKC-θ binding as detected by ChIP-seq (Hugene 2.0 Affymetrix arrays). The heat map shows log2 expression values scaled across the gene and clustered by Euclidean distance using complete linkage. Black asterisks mark PKC-θ binding regions that contain the NF-κB binding motif. Green asterisks mark genes that are induced by TGF-β in HMLE. Blue, low expression; red, high expression. (E) PKC-θ binding at JUNB and KLF10 in nonstimulated (NS) and PMA-stimulated (ST) MCF-7 cells. ChIP-seq read counts (number of reads per million mapped reads) are shown for PKC-θ and total input samples in the UCSC genome browser. The RoadMap data for H1-derived mesenchymal stem cells show permissive histone environments (red, high H3K4me3 and histone acetylation) near the PKC-θ binding peaks. Peaks called by Zinba are shown with their P values, while peaks called by BayesPeak are shown with posterior probabilities.

