FIG 6.
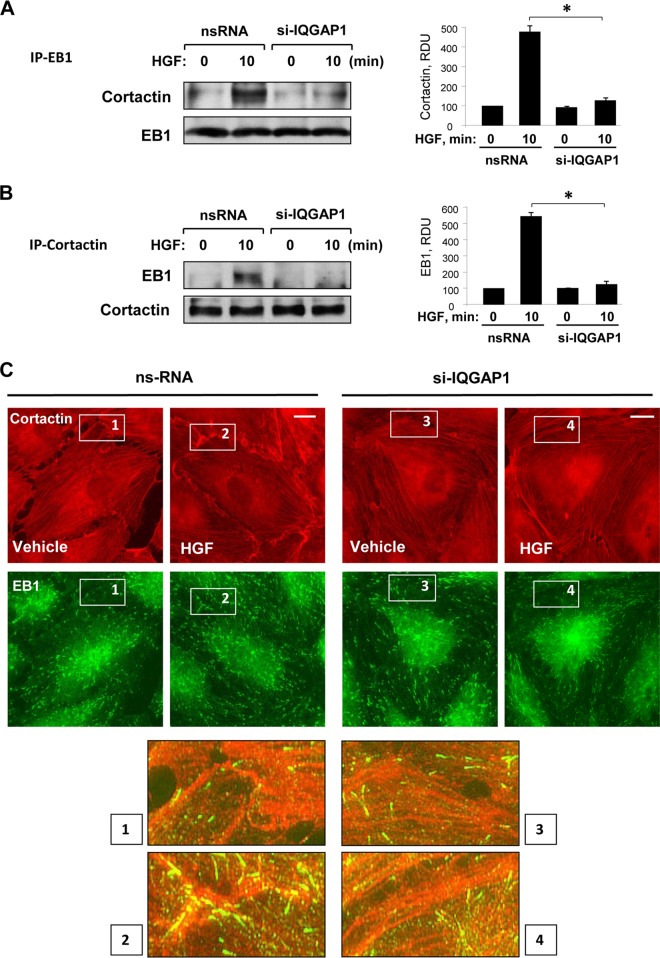
HGF-induced EB1 and cortactin interactions are IQGAP1 dependent. (A, B) HPAEC treated with nonspecific RNA (nsRNA) or IQGAP1-specific siRNA (si-IQGAP1) were used for reciprocal coimmunoprecipitation (IP) assays with EB1 (A) and cortactin (B) antibodies, followed by Western blot assay detection of cortactin and EB1. Bar graphs depict quantitative densitometry analysis of immunoblotting data. Results are presented as mean ± SD; *, P < 0.05; n = 4. RDU, relative density units. (C) HPAEC grown on glass coverslips were stimulated with HGF (50 ng/ml); this was followed by double immunofluorescence staining for cortactin (red) and EB1 (green). The insets are shown at the bottom as higher-magnification images of the peripheral cell areas marked by quadrangles in the upper panels and depict cortactin and EB1 colocalization, which is yellow. Shown are representative results of three independent experiments. Bars = 5 μm.

