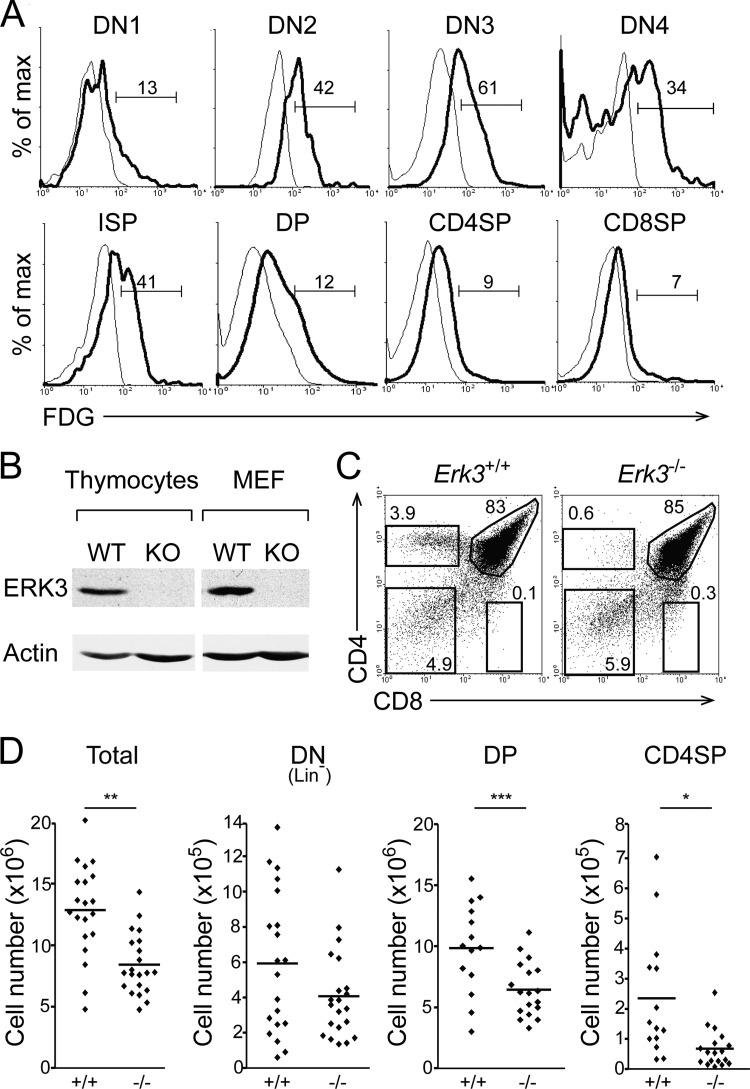
FIG 1.
Reduced thymocyte number and defective CD4SP thymocyte differentiation in Erk3−/− newborn thymus. (A) Representative overlay histograms of ERK3 expression during thymocyte differentiation. Thymocytes from Erk3+/− (thick line) and Erk3+/+ (thin line) mice were cell surface stained, permeabilized, and exposed to FDG. Numbers indicate the percentages of FDG+ cells. (B) ERK3 protein expression in Erk3+/+ (WT) and Erk3−/− (KO) thymus. Lysates of newborn thymocytes from Erk3+/+ and Erk3−/− mice were immunoblotted with an anti-ERK3 antibody. Murine embryonic fibroblasts (MEF) were used as controls. (C) Representative thymic profile of newborn Erk3+/+ and Erk3−/− mice. The percentages of cells in the different thymocyte subsets are indicated on the dot plot. (D) Cell numbers for the different thymocyte populations are shown for Erk3+/+ and Erk3−/− newborn mice. The bars represent the mean values; each dot corresponds to one mouse. Data are representative of at least 4 independent experiments. *, P < 0.05; **, P < 0.01; ***, P < 0.001; two-tailed Student's t test.

