FIG 6.
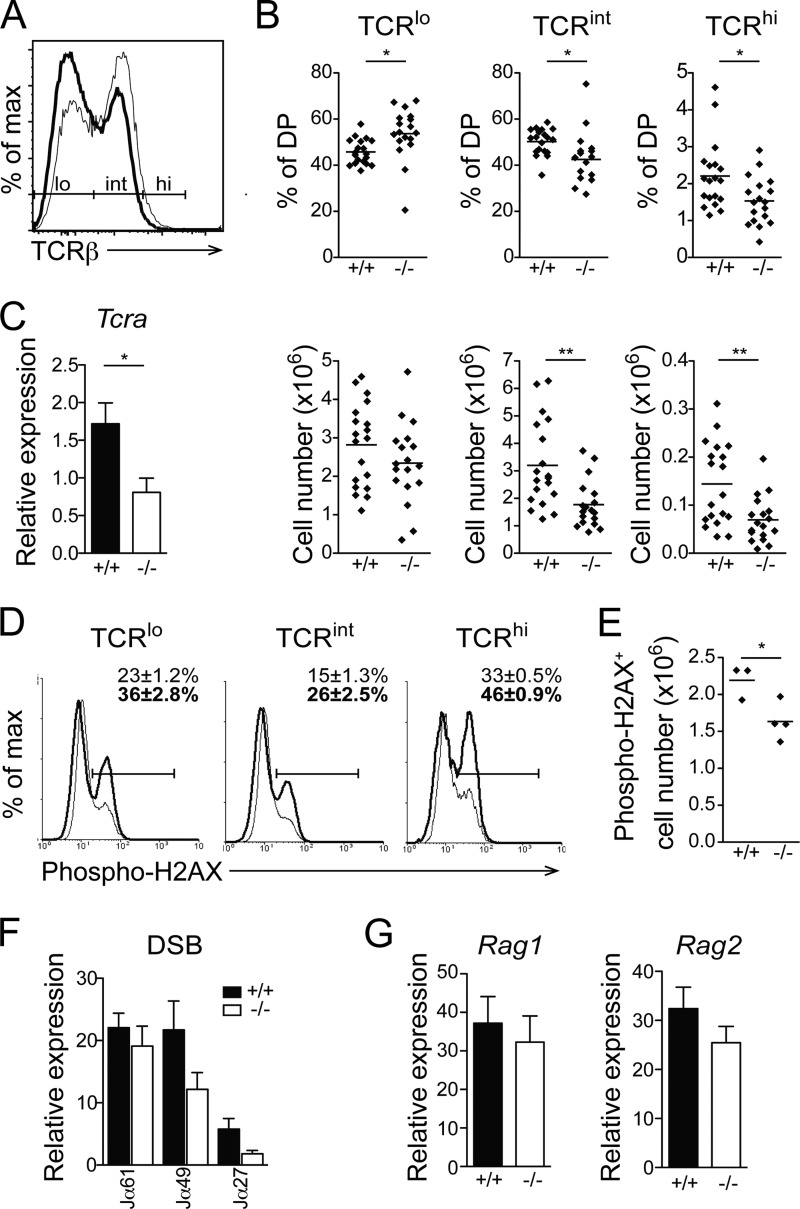
Reduced TCR expression in Erk3−/− DP thymocytes. (A) Cell surface expression of TCRβ in Erk3−/− DP thymocytes from E18.5 embryos. The representative overlay shows TCRβ cell surface expression by Erk3+/+ (thin line) and Erk3−/− (thick line) DP thymocytes. (B) Quantification of the percentages (top) and numbers (bottom) of TCRlo, TCRint, and TCRhi DP thymocytes. The bar represents the mean value, and each dot corresponds to one mouse. (C) Real-time PCR analysis of Tcra gene expression on sorted DP thymocytes from Erk3+/+ and Erk3−/− mice. (D) Overlay histograms show phospho-H2AX staining in Erk3+/+ (thin line) or Erk3−/− (thick line) DP (TCRlo, TCRint, and TCRhi) thymocytes from E18.5 embryos. Numbers on the graph indicate the means ± SEM of the percentages of phospho-H2AX-positive cells. (E) The numbers of phospho-H2AX-positive cells in total DP thymocytes are shown for Erk3+/+ and Erk3−/− newborn mice. (F) Quantification of DNA DSBs at different Jα gene segments. Genomic DNA isolated from DP thymocytes of Erk3+/+ and Erk3−/− mice was subjected to ligation-mediated qPCR. (G) mRNA quantification of Rag1 and Rag2 on sorted DP thymocytes from Erk3+/+ and Erk3−/− mice. Data are representative of at least 3 independent experiments. *, P < 0.05; ***, P < 0.01; two-tailed Student's t test.

