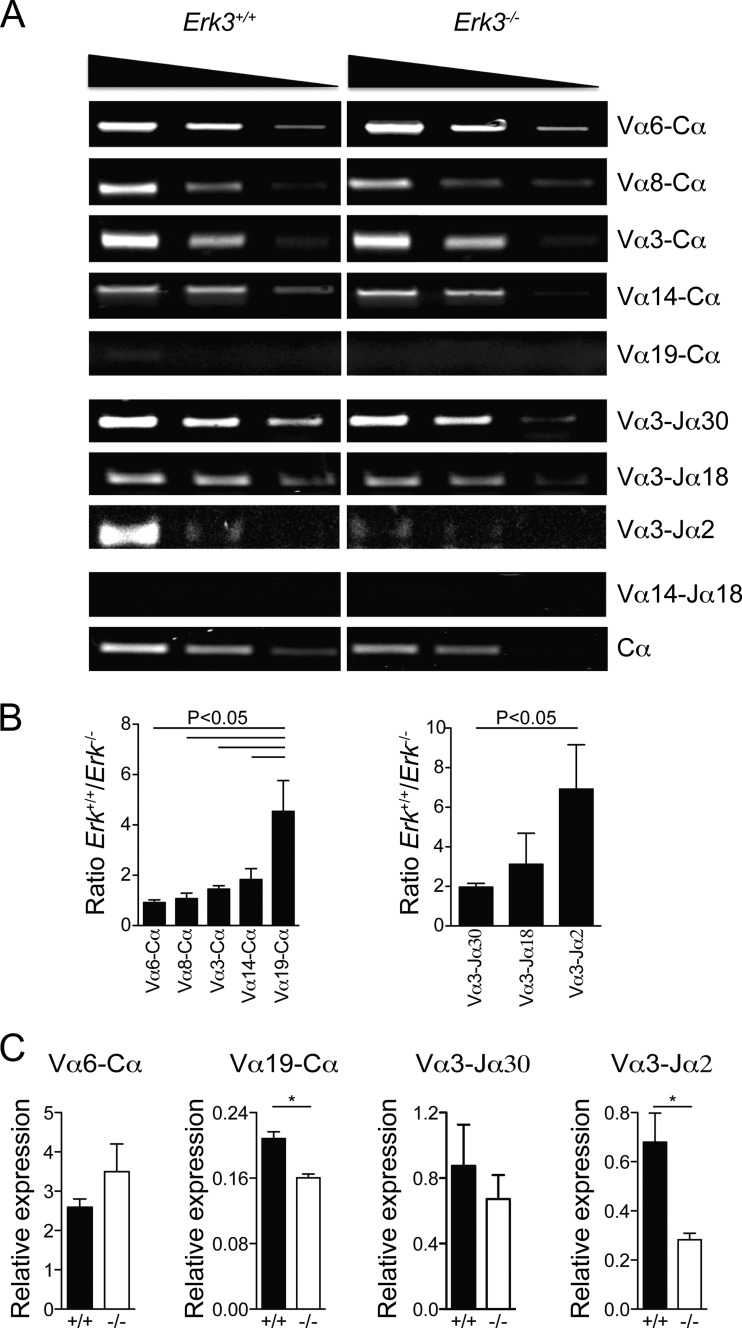
FIG 7.
Reduced usage of distal Tcra gene segments in ERK3-deficient mice. (A) Semiquantitative reverse transcription-PCR (RT-PCR) of different rearranged segments is shown for Erk3+/+ (left) and Erk3−/− (right) mice. The first panel represents different pairs, from the most proximal Vα segment (Vα6; top) to the most distal Vα segment (Vα19; bottom). The second panel represents different Jα and Vα3 combinations. The third panel uses a combination of both distal Vα14 and Jα18 segments. The fourth panel represents the amplification of the Tcra constant region (Cα) and serves as the endogenous control. The top triangles indicate the cDNA dilution. (B) Compilation of cDNA band intensity measurement (intensity score) normalized to the intensity of the Cα band. In each graph, more proximal to more distal rearrangements are shown from left to right. Results are presented as a ratio of Erk3+/+ to Erk3−/− intensity scores. The mean ± SEM are shown for each pair segment. (C) Quantitative PCR analysis of TCRα secondary gene rearrangements. Data are representative of at least 2 independent experiments. *, P < 0.05; ANOVA with Bonferroni posttest was used for panel B, and a two-tailed Student's t test was used for panel C.

