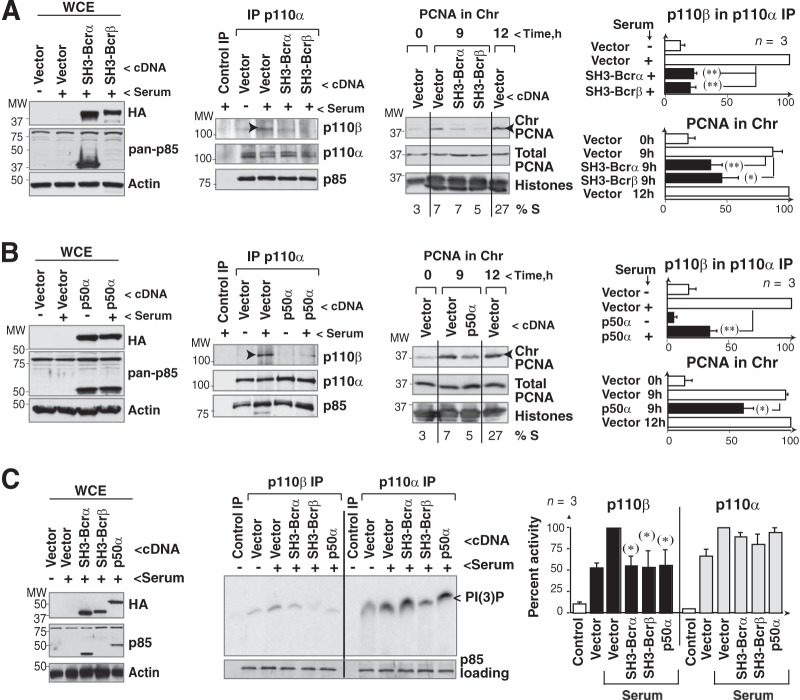
FIG 5.
Interference with p110α/p110β association reduces p110β activity. (A and B) NIH 3T3 cells were transfected with SH3-BcRα, SH3-BcRβ (A) or p50α cDNA (B) (24 h), and protein expression was analyzed by WB. The anti-pan-p85 Ab did not recognize SH3-BcRβ. Cells were also incubated without serum (19 h) and stimulated by serum addition (1 h), and extracts were immunoprecipitated with anti-p110α Ab. We used protein A plus cell extract as a control. p110β in complex with p110α was analyzed by WB. NIH 3T3 cells were also collected at 9 or 12 h post-serum addition (S-phase entry; percent indicated) and fractionated as cytosolic, nuclear, and chromatin extracts, and the amount of PCNA in chromatin (Chr) was determined by WB. Graphs show the percentage of p110β in complex with p110α relative to the maximum (in controls, indicated with arrowheads, 100%) and that of PCNA bound to chromatin relative to the maximum (with control cells at 12 h as 100%, indicated with arrowheads; means ± standard errors of the means [SEM], n = 3). (C) p110α or p110β was immunoprecipitated from extracts of cells transfected as described for panels A and B; the amount of precipitated PI3K was tested by WB with an anti-pan-p85 Ab. PI3K activity was tested in vitro. WCE were also analyzed by WB. The graph shows PI(3)P signal relative to the maximum for p110α or p110β (100%; mean ± SEM, n = 3). *, P < 0.05; ** P < 0.01 (Student's t test).

