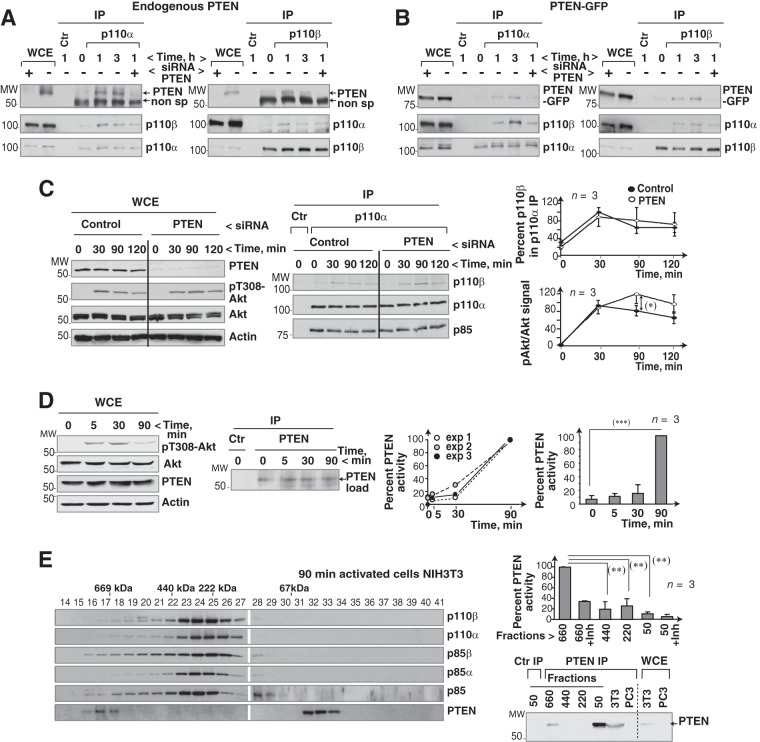
FIG 6.
PTEN binds to the p110α/p110β complex. (A) 293T cells were incubated in serum-free medium (2 h) and stimulated with serum. Prior to stimulation, some of the cells were transfected with PTEN-specific siRNA (48 h). Extracts were immunoprecipitated with anti-p110α or anti-p110β Ab and tested for associated PTEN by WB. (B) 293T cells were transfected with PTEN-GFP (48 h) and control or PTEN-specific siRNA (48 h); cells were then incubated without serum (2 h) and serum stimulated for the indicated times. We tested PTEN-GFP in p110α or p110β immunoprecipitates by WB. For controls, extracts were incubated with an irrelevant Ab. (C) U2OS cells were transfected with control or PTEN siRNA (48 h) and activated as described for panel A for the indicated times. Transfection efficiency and pAkt levels were analyzed by WB. p110β in complex with p110α was analyzed by WB. Graphs show the percentage of p110β in complex with p110α relative to the maximum (100%) and that of pAkt signal normalized to Akt levels and relative to the maximum (100%) (mean ± SEM, n = 3). (D) To determine optimal PTEN activation time, we incubated NIH 3T3 cells without serum (19 h) and stimulated them with serum for various times. Extracts were analyzed by WB or immunoprecipitated with anti-PTEN Ab and tested in an in vitro phosphatase assay using PI(3,4,5)P3 as the substrate. Phosphate release was analyzed, using an ELISA reader, based on the A620. Values after background subtraction were normalized to PTEN loading. The left graph shows the percentage of PTEN activity relative to the maximum (A620 at 90 min; 100%) in three independent experiments; the right graph shows mean ± SEM PTEN activity (n = 3). Maximum phosphate released at 90 min was ∼103 pmol. (E) Extracts of serum-stimulated NIH 3T3 cells (10%; 90 min) were resolved by gel filtration and analyzed by WB. PTEN was immunoprecipitated from different fractions (as indicated) and analyzed by WB and in a PTEN activity assay. For the ∼50- and ∼660-kDa fractions, duplicate precipitates were tested in the presence of a PTEN inhibitor (bpV, 100 nM). The graph shows PTEN activity for each condition relative to the maximum (100%, 90 min in the ∼660-kDa fraction; mean ± SEM, n = 3). *, P < 0.05; **, P < 0.01; ***, P < 0.001 (Student's t test).

