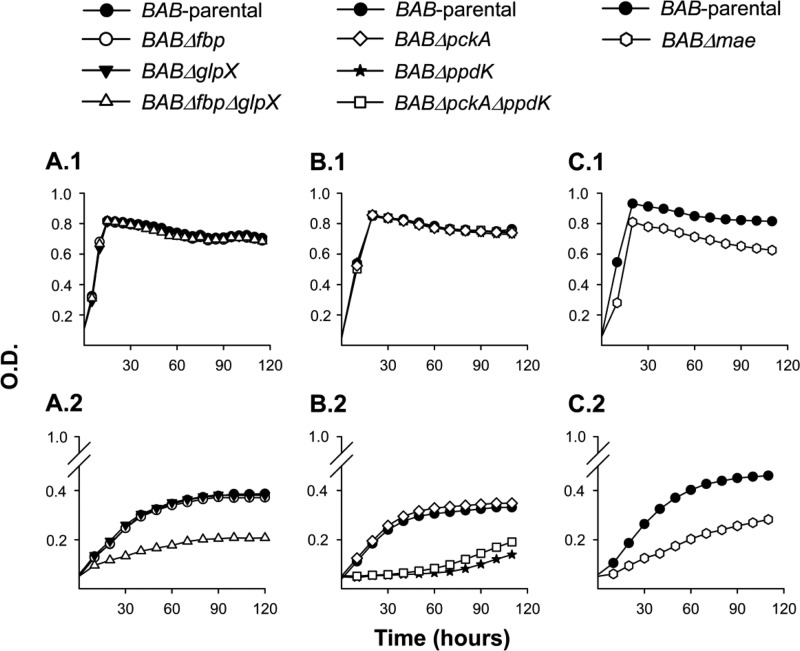
FIG 2.
Growth curves in peptone-yeast extract-glucose (A.1, B.1, and C.1) and glutamate-lactate-glycerol (A.2, B.2, and C.2) of BAB-parental and the mutants BABΔfbp, BABΔglpX, BABΔfbpΔglpX, BABΔpckA, BABΔppdK, BABΔpckAΔppdK and BABΔmae. Each point represents the mean ± standard error (error bars are within the size of the symbols) of optical density (O.D.) values for triplicate samples. The experiment was repeated three times with similar results.

