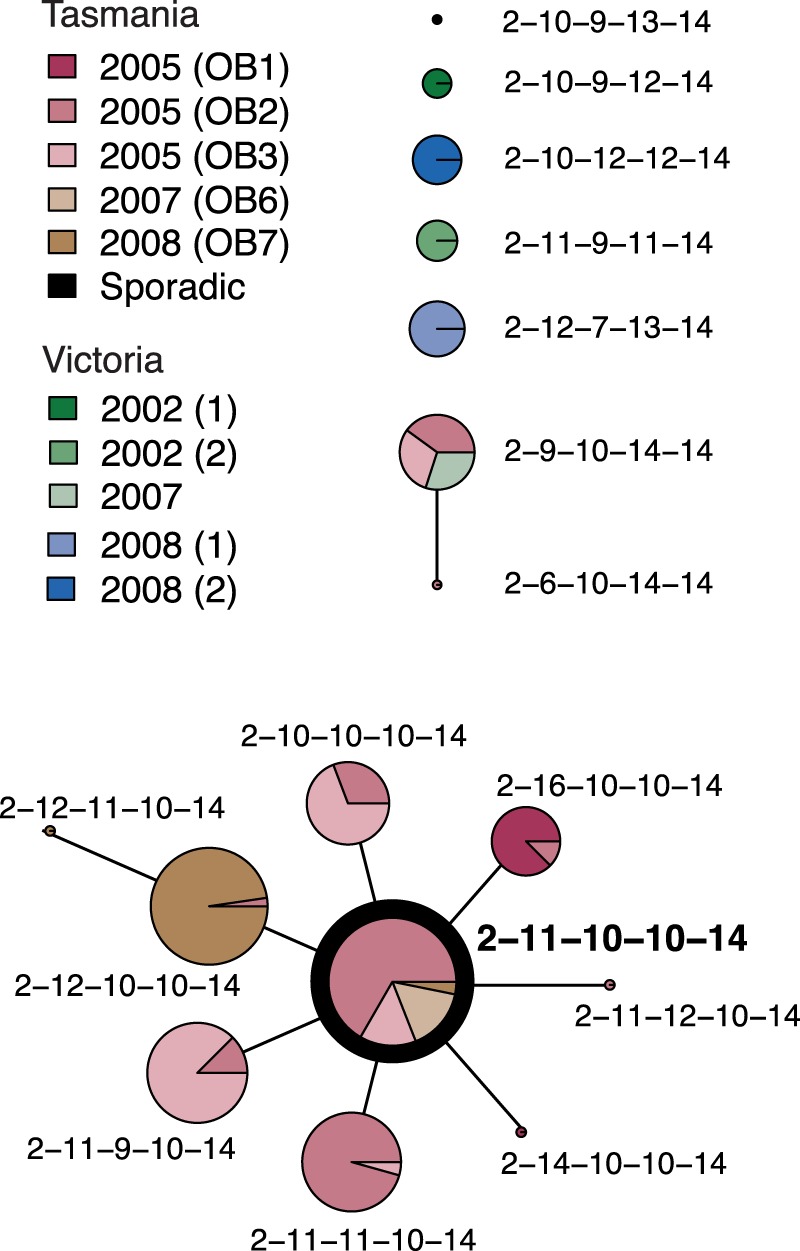
FIG 1.

eBURST analysis of 203 S. Typhimurium 135@ isolates. Each MLVA profile is shown as a pie chart whose size represents the number of isolates with that profile, and colored slices indicate the outbreaks (OB) to which these isolates were linked during epidemiological investigations conducted at the time. The inferred founder profile is highlighted in bold.
