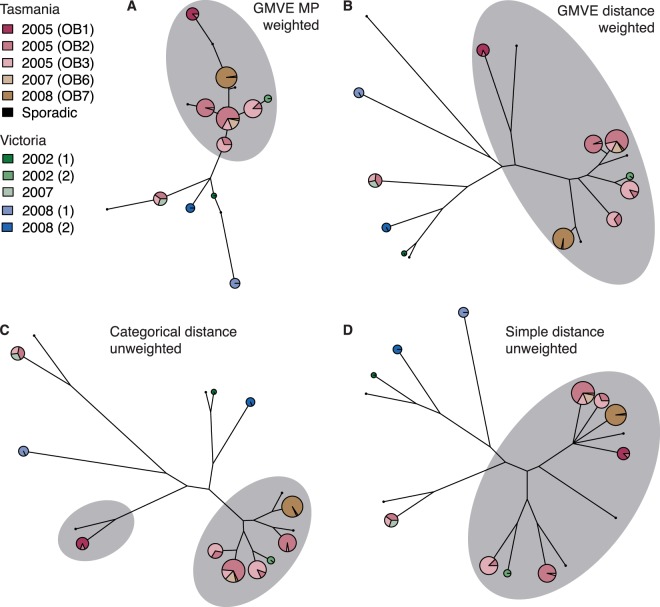
FIG 3.
Tree building with MLVA data. Analysis of 203 STm135@ isolates associated with Tasmanian and Victorian outbreaks. Pie graphs indicate MLVA profiles; circle size indicates the number of isolates with that profile, and colored segments indicate proportions of isolates from different outbreaks (colored according to the inset legend). Isolates belonging to the outbreak clone are highlighted with a gray background. GMVE, geometric model of VNTR evolution; MP, maximum-parsimony inference. Otherwise, trees are the result of UPGMA clustering of the specified distance metric.

