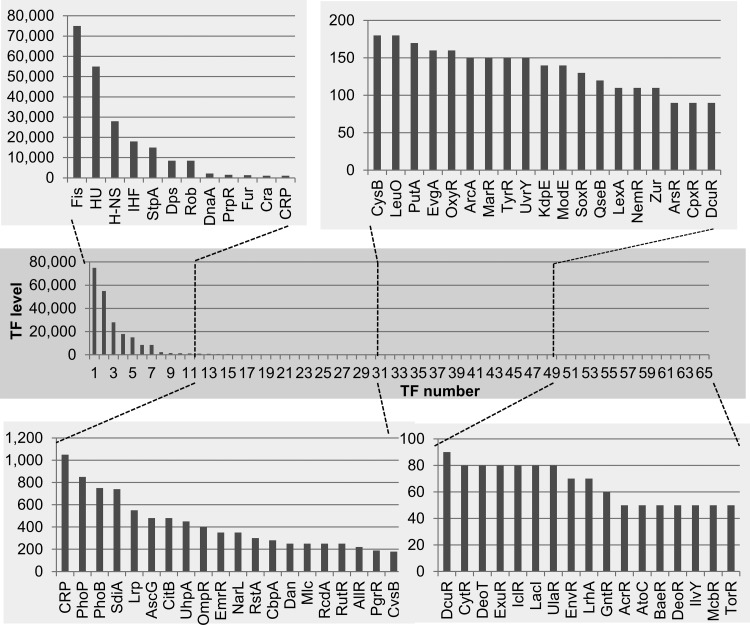
FIG 1.
Intracellular concentration of TFs in exponential-phase cells of E. coli K-12 W3110. Cells were grown in LB-glucose medium at 37°C with shaking. In the middle of exponential phase (optical density at 600 nm [OD600], 0.4), cells were harvested and the cell lysate was prepared by the standard method (27–29). The intracellular concentration was determined for a total of 65 species of TF by the quantitative immunoblot method as described in Materials and Methods. The TF concentration was calculated as the relative value to that of RNA polymerase RpoA subunit and is represented as the number of molecules per genome equivalent of DNA. TF level (y axis) represents the number of TF molecules per genome.

