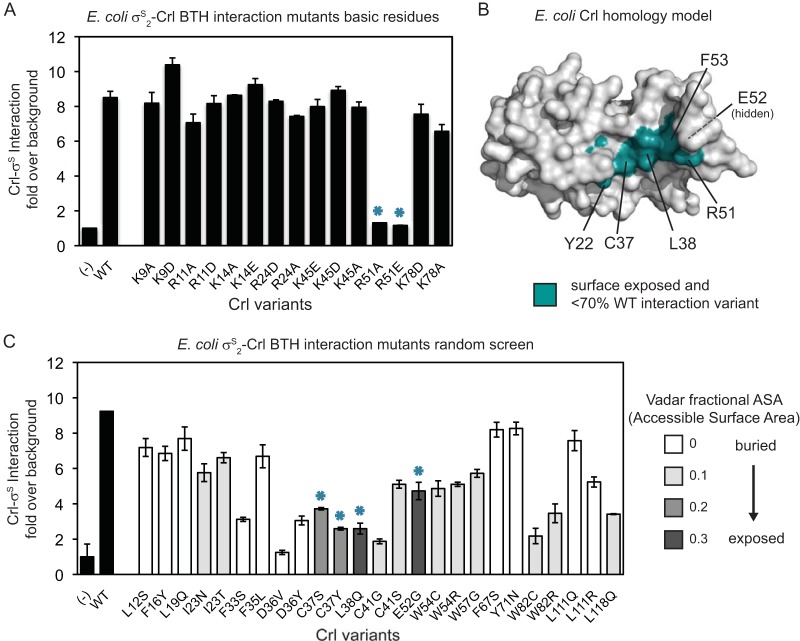
FIG 3.
Crl-σS2 BTH interaction analysis. (A) BTH assay indicating levels of interaction between σS2 and Crl variants generated by site-directed mutagenesis of conserved basic residues. The bars represent β-galactosidase activity in Miller units over background (an unfused control). The error bars show the SD from 2 separate experiments with 2 independent cultures each. The asterisks indicate variants that have reduced interaction. (B) Surface representation of a homology model of E. coli Crl. Surface-exposed conserved residues identified from our BTH analyses are shown in teal, as are F53 and Y22, which were identified in a previous study (48). Residue E52 (labeled “hidden”) is surface exposed but is not visible in this view. (C) BTH assay as in panel A, except with Crl variants generated by random PCR mutagenesis. Black bars, WT Crl and an unfused control (−). The bar shading of the variants indicates the fractional ASA determined by Vadar (43). The asterisks indicate variants that have reduced interaction and more surface exposure.

