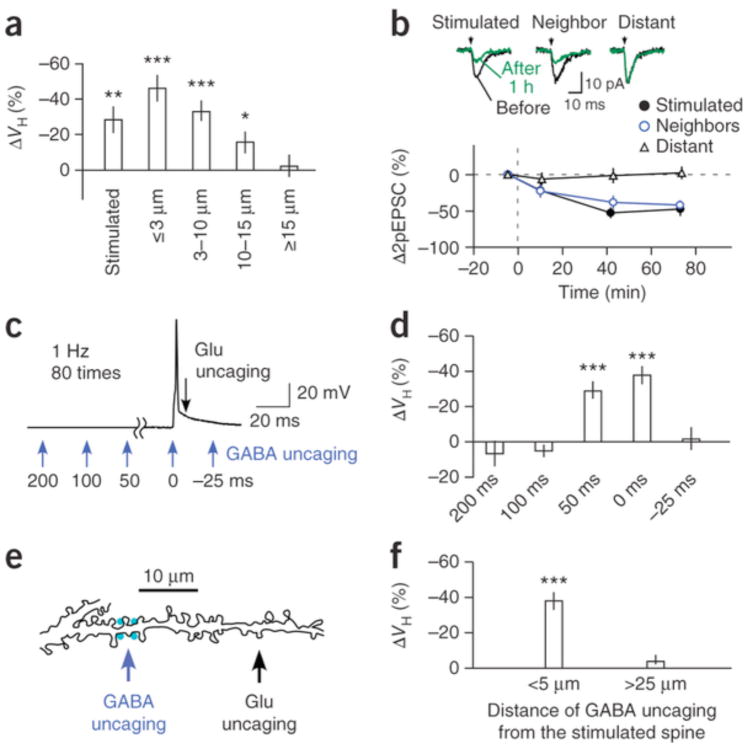
Figure 2. Spine shrinkage spread and GABA effects.
14 slices, 10 rats) and neighboring spines at ≤3 μm (15 spines), 3–10 μm (41 spines), 10–15 μm (17 spines) and ≥15 μm (9 spines) from the stimulated spines. (b) The time courses of current amplitudes evoked by glutamate uncaging in stimulated (9 spines, 9 dendrites, 9 slices, 7 rats), neighboring (<3 μm, 10 spines, 9 dendrites, 9 slices, 7 rats) and distant spines (>15 μm, 8 spines, 8 dendrites, 7 slices, 6 rats). The insets show an example of current traces (two-photon stimulation–induced EPSCs (2pEPSCs)) before and after LTD induction. (c) Time points (blue arrows) of GABA uncaging relative to spike onset. (d) Timing dependence of GABA uncaging on spine shrinkage (Supplementary Fig. 3c,d). (e) A drawing of a dendritic shaft where GABA uncaging was applied 25 μm from the stimulated spine. (f) Spine shrinkage was detected when GABA uncaging was within 5 μm of the stimulated spines (33 spines, 14 dendrites, 14 slices, 10 rats) but not when GABA uncaging was more than 25 μm away from the stimulated spines (21 spines, 6 dendrites, 6 slices, 3 rats). Data are presented as mean ± s.e.m. *P < 0.05, **P < 0.01,***P < 0.001 versus 0% by Wilcoxon signed-rank test.

