
Fig. ED5. Positive and negative mode MSMS fragmentation spectra of representative abundant glycerophospholipids released from ESyt-2 expressed in mammalian cells, under denaturing MS conditions.
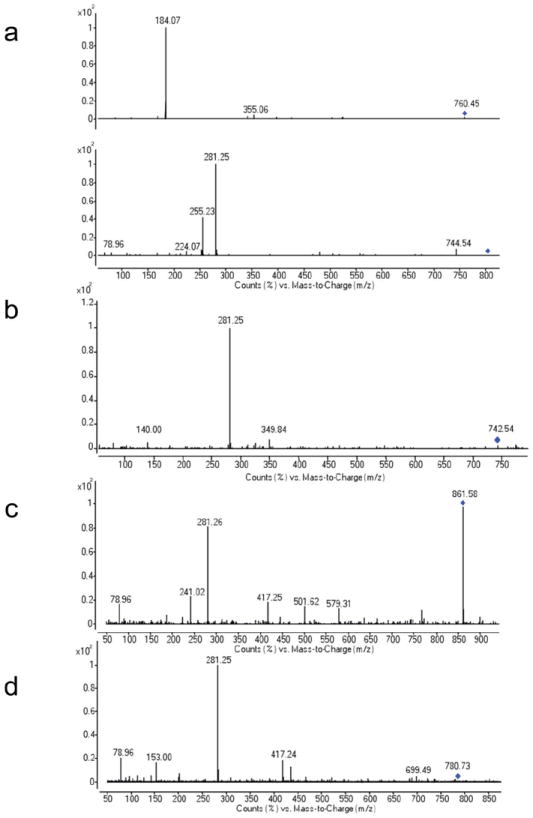
(a) Fragmentation of PC 16:0/18:1 (760.45 m/z). (b) Fragmentation of PE 18:1/18:1 (742.53 m/z). (c) Fragmentation of PI 18:1/18:1 (861.58 m/z). (d) Fragmentation of PS 18:1/18:1 (786.53 m/z).