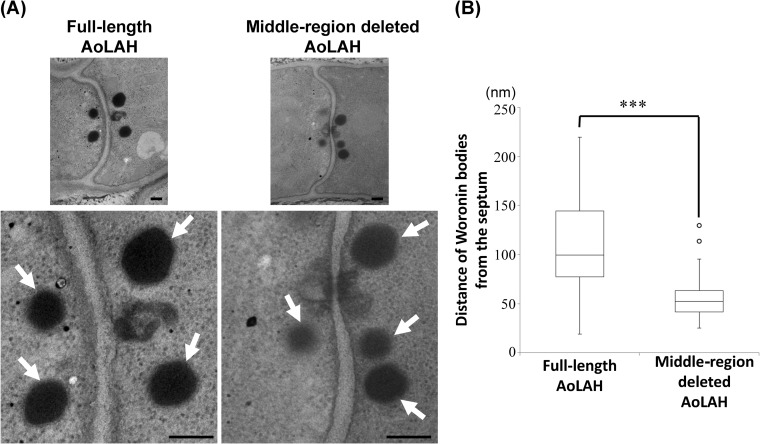
FIG 5.
Transmission electron microscopy of Woronin bodies in the Aolah disruptant strain expressing full-length or middle-region-deleted AoLAHs. (A) Transmission electron microscopy of Woronin bodies located around the septum in the strain expressing full-length or middle-region-deleted AoLAH. Arrows indicate Woronin bodies. Bars, 200 nm. (B) Distance of Woronin bodies from the septum in the strain expressing full-length or middle-region-deleted AoLAH. The data are presented in the box plot chart. The top, bottom, and middle lines correspond to the 75th percentile, 25th percentile, and median, respectively; bars represent the limits of the upper (top) and lower (bottom) quartiles. The whiskers show the highest and lowest readings within a 1.5× interquartile range. The outliers are indicated by ○ (n = 44 and 48 for strains expressing full-length AoLAH and middle-region-deleted AoLAH, respectively; ***, P < 0.001).

