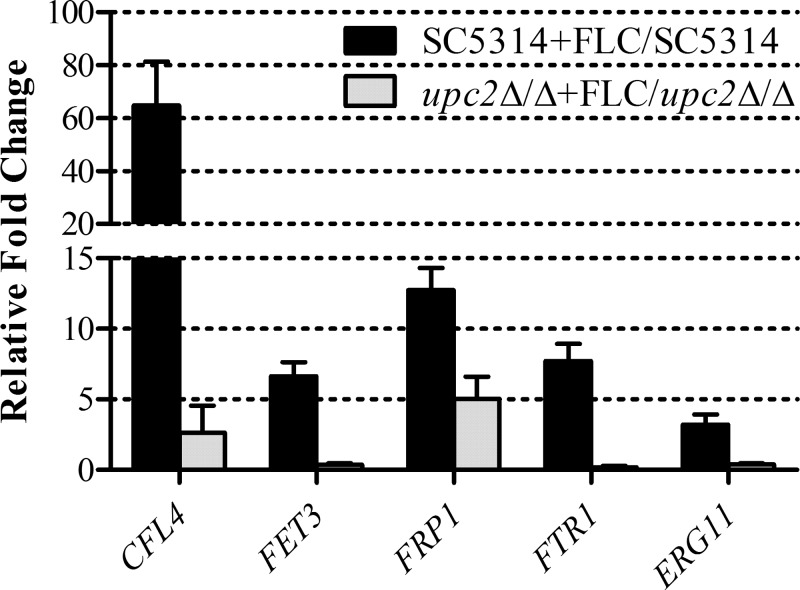
FIG 5.
Validation of fluconazole-inducible and Upc2-dependent iron gene expression. Levels of CFL4, FET3, FRP1, FTR1, and ERG11 expression were measured in triplicate by qRT-PCR and were compared to the expression levels in SC5314. Shown are the relative n-fold changes in gene expression in SC5314 and upc2Δ/Δ cells treated with fluconazole (FLC). Error bars represent the standard errors of the means.

