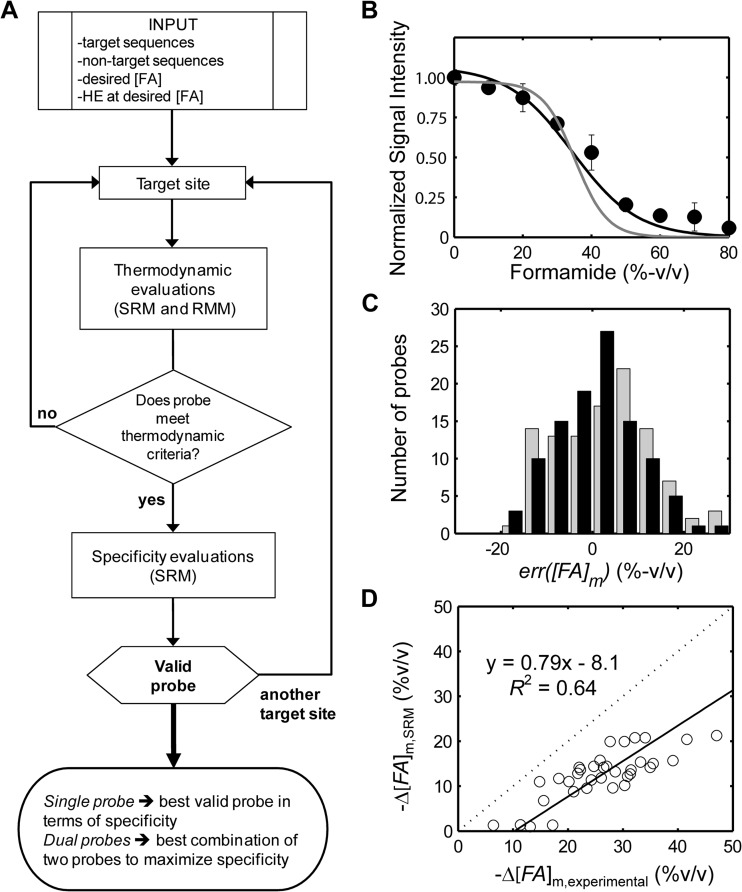
FIG 1.
Probe design algorithm and modeling. (A) Flow chart summary of design algorithm. The feedback loop on the right indicates the iterative procedure to find all possible probe candidates for a target, all of which are used in the output decision. See Fig. S6 in the supplemental material for a more detailed representation. [FA], concentration of formamide; HE, hybridization efficiency. (B) Example predictions (probe St796-813) based on leave-one-probe-out cross validation (LOPOCV) (supplemental material) for the single-reaction model (SRM) (black) and retrained mechanistic model (RMM) (gray). Experimental data are included as data points with standard deviations (error bars). See Fig. S1 for all plots. (C) Distribution of the melting prediction errors during LOPOCV for SRM (black bars) and RMM (light gray bars). The majority of probes are associated with predictions of less than 10% formamide error for both models. SRM errors are smaller by about 1.4% formamide on average, and they are more normally distributed due to improvements in the model's goodness of fit. (D) Correlation of experimental and theoretical offsets in melting points due to incorporation of a single mismatch. The equation indicates that SRM is a conservative predictor of mismatch stability, with the experimental offset being higher than predicted.

