FIG 2.

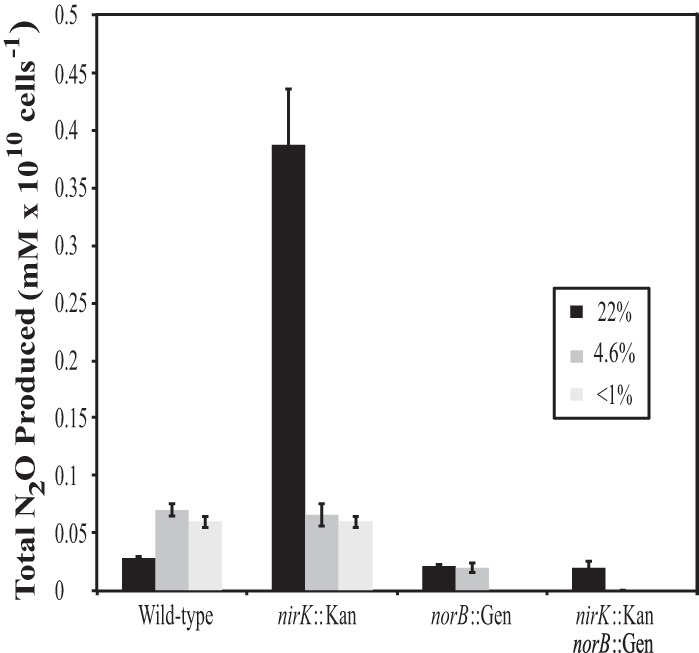
Total N2O produced by all strains after 72 h of growth at high (n = 8) and low (n = 6) oxygen. N2O profiles under anoxia (n = 8) were collected during resting-cell assays. Data are presented as means ± SEs.

Total N2O produced by all strains after 72 h of growth at high (n = 8) and low (n = 6) oxygen. N2O profiles under anoxia (n = 8) were collected during resting-cell assays. Data are presented as means ± SEs.