
FIG 1.
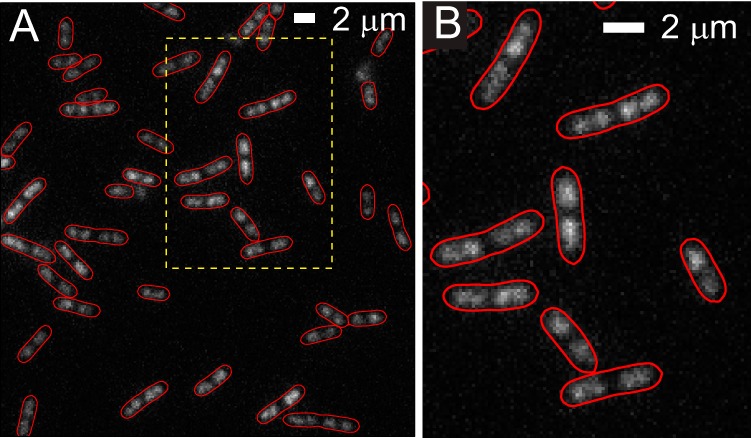
Fluorescence image of E. coli cells stained by SYTOX orange. The red cell outline is created from the phase-contrast images using MicrobeTracker. (A) Large field of view. (B) Zoomed-in view of the dashed box in panel A. For comparison with HU-YFP images, see Fig. S3 in the supplemental material.