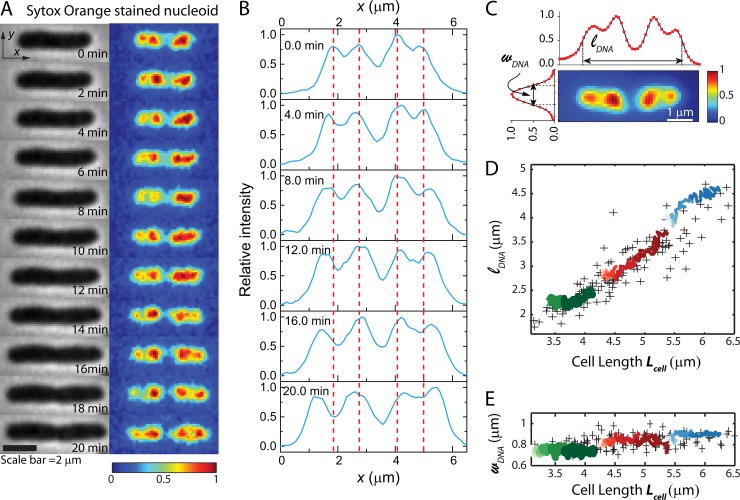
FIG 2.
Nucleoid morphology versus time from SYTOX orange staining of a single cell. (A) Time course of phase-contrast images (left) and SYTOX orange-stained DNA images of a single cell. Each false-color image of the fluorescence intensity has background subtracted and intensities scaled so that the maximum pixel intensity is 1 and the minimum is 0. This relative scale provides correction for photobleaching and volume dilution over the 20-min observation period. (B) Axial line scans of SYTOX orange intensity over time for the same cell as in panel A. (C) Fluorescence image of a different cell stained with SYTOX orange. Features of the axial and transverse line scans define the nucleoid length, lDNA, and width, wDNA. (D and E) For 142 cells stained with SYTOX orange and imaged once, scatter plots (“+” symbols) of the lDNA (D) and wDNA (E) versus tip-to-tip cell length, Lcell, are shown. The green, red, and blue traces show lDNA(t) and wDNA(t) versus Lcell for three single cells over 20 min of observation. For each cell, time progresses from left to right (lighter shade to darker shade).

