FIG 3.
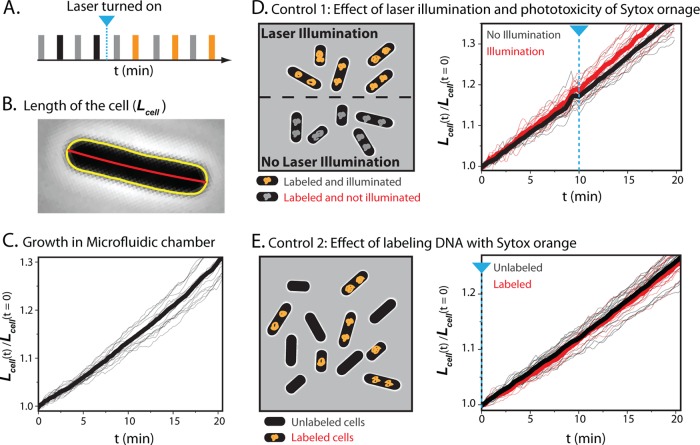
Growth control experiments using SYTOX orange staining and 561-nm laser light. (A) Schematic of alternating illumination for phase-contrast and fluorescence imaging. Alternate laser illumination begins at the time indicated by a blue line. (B) Tip-to-tip length of the cell is calculated from the red centerline of the yellow outline of the cell obtained from MicrobeTracker. (C) Relative cell length versus time for 18 cells subjected only to phase-contrast imaging (thin black lines). The thick black line is the mean of the 18 traces. (D) On the left is a schematic of first growth control experiment; see the text. On the right is shown relative cell length versus time for SYTOX orange-labeled cells that are illuminated (thin red lines; 11 cells) or not illuminated (thin gray lines; 18 cells). Thick lines show the mean in each case. In both panels D and E, the blue dashed line indicates the onset of 561-nm illumination. (E) On the left is a schematic of second growth control experiment; see the text. On the right is shown relative cell length versus time for SYTOX orange-labeled cells (thin red lines; 7 cells) with cells that are not stained (thin gray lines; 19 cells). Thick lines are means. The two cell types received the same illumination.

