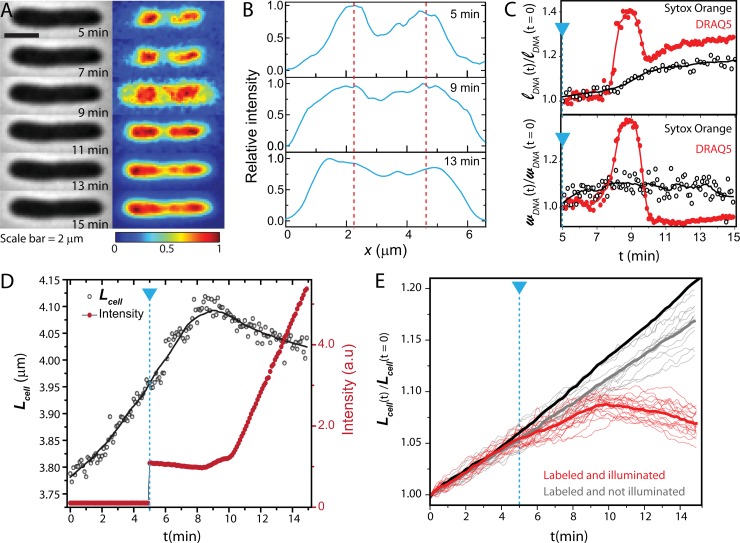
FIG 4.
(A) Phase-contrast and fluorescence images of a DRAQ5-stained cell over 10 min. Signals in each frame are background subtracted and then normalized so that the maximum pixel intensity is 1 and minimum is 0. (B) Axial intensity profiles of the DRAQ5 fluorescence. (C) Time course of lDNA and wDNA of the cell shown in panel A, plotted as red circles. The laser is turned on at 5 min. Solid lines are spline interpolation to guide the eye. For comparison, we also show a plot of lDNA and wDNA versus time for a SYTOX orange-stained cell (black open circles). (D) Time course of Lcell (black circles) and total DRAQ5 intensity for the same single cell as in panel A. The blue dashed line marks the onset of 633-nm illumination. (E) Relative changes in cell length over time are plotted for DRAQ5-labeled cells that are illuminated by the laser (red line) and that are not illuminated by the laser (gray lines). Heavy red and gray lines are means. The heavy black line is mean curve for untreated cells.

