
FIG 5.
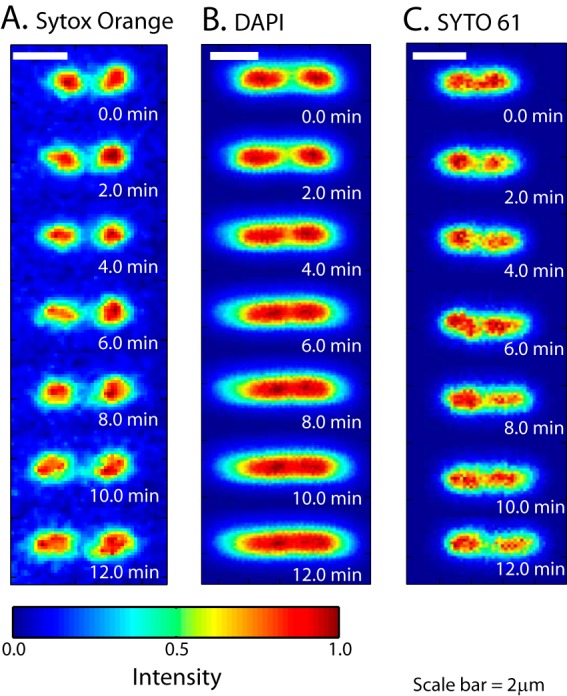
Comparison of time-lapse images of nucleoid morphology for three different stains: SYTOX orange (A), DAPI (B), and SYTO 61 (C). The three cells have similar lengths. In the relative intensity scale, 0 is the background level and 1 denotes the brightest pixel in each image.