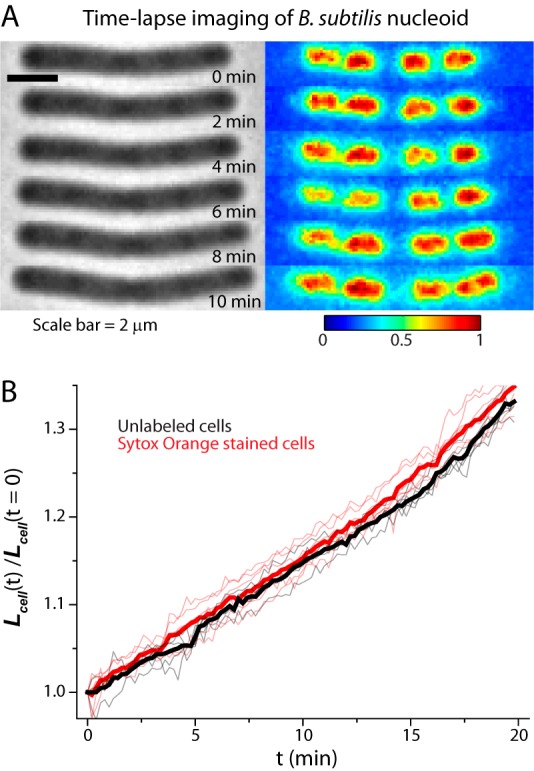
FIG 6.

(A) Time-lapse imaging of B. subtilis using phase-contrast and SYTOX orange fluorescence. Fluorescence images at each time point are background subtracted and then normalized so that the maximum pixel intensity is 1 and minimum is 0 to correct for photobleaching. (B) Relative changes in cell length versus time are plotted for illuminated SYTOX orange-labeled cells (red line; 6 cells) and for unlabeled cells without illumination (gray lines; 5 cells). Mean trends are shown as thick lines.
