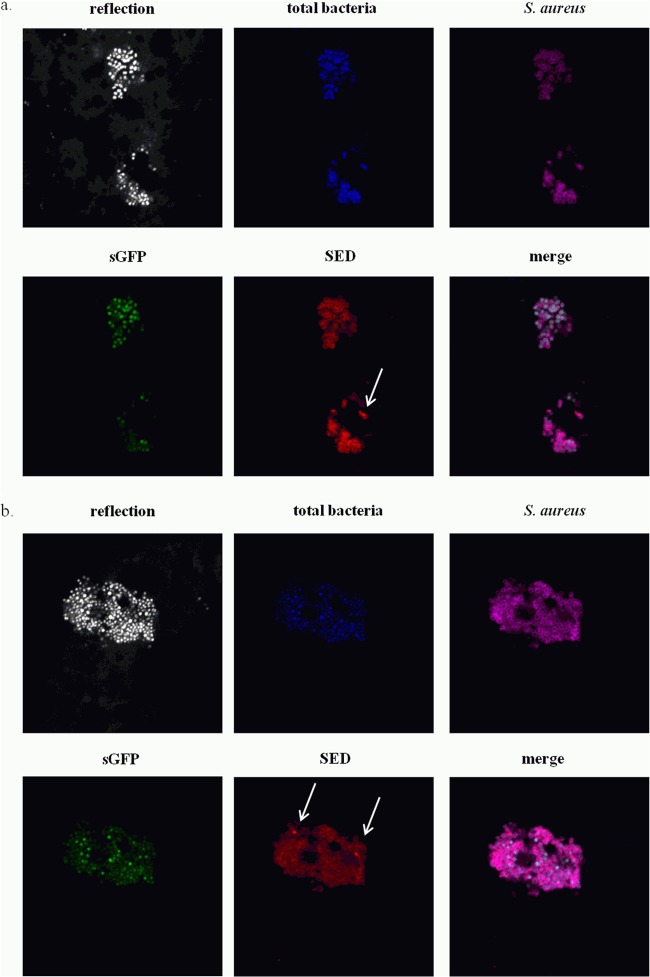
FIG 5.
Confocal laser scanning micrographs of S. aureus CIM433/pCM11 in the cheese core (a) and on the cheese surface (b) at day 15. The cheese sample structure is visualized by the reflection of the 405-nm laser diode in a grayscale image. Dairy bacteria and pathogens are blue, S. aureus strains are magenta, sgfp expression is green, and SED is red. Representative images of merged channels are also shown. SED-positive bacteria are indicated by arrows.

