
FIG 2.
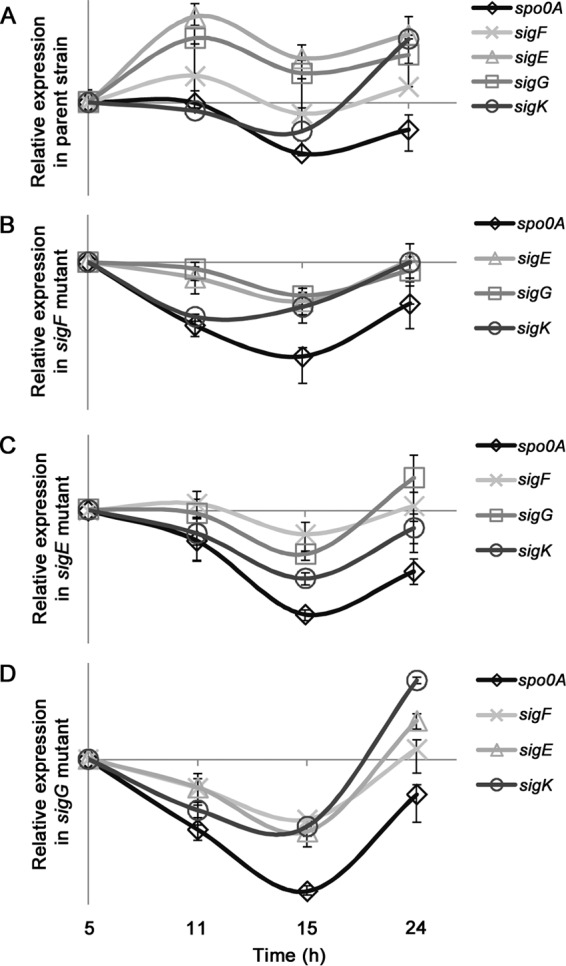
Gene expression trends of Clostridium botulinum ATCC 3502 parent strain (A), sigF mutant (B), sigE mutant (C), and sigG mutant (D) with sense-oriented ClosTron insertions showing target gene spo0A, sigF, sigE, sigG, and sigK expression levels at 5, 11, 15, and 24 h of growth. Transcript levels of each gene were normalized to 16S rrn transcript levels and calibrated to levels at 5 h. As the target genes could not be calibrated to each other, values on the y axis were omitted, as relative expression ratios between target genes within each strain cannot be quantifiably compared.