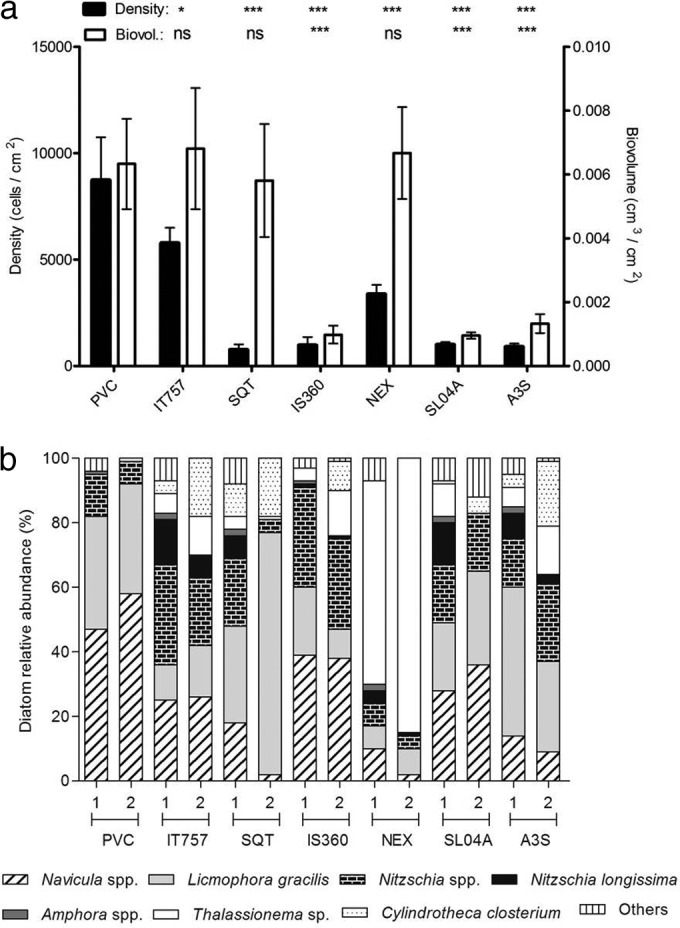
FIG 6.

Diatom total (a) and relative (b) abundances on the seven coatings expressed in both cells/cm2 and biovolumes (cm3/cm2). * (P < 0.05) and *** (P < 0.001) indicate that diatom density or biovolume was significantly different on the coating compared to that on PVC. ns (not significant) indicates that diatom density or biovolume on the coating was not significantly different compared to that on PVC.
