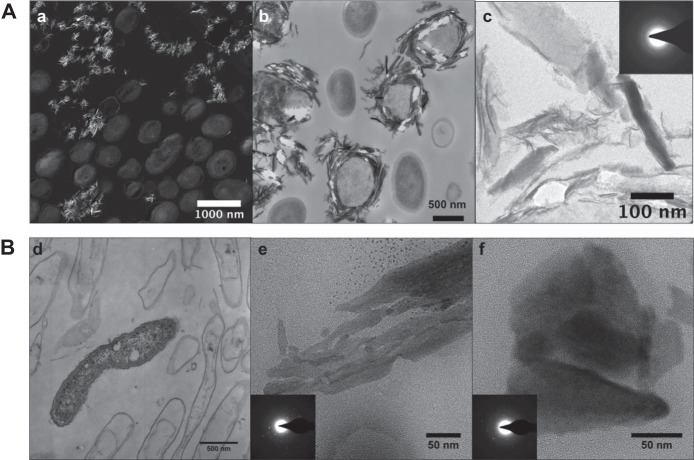
FIG 4.
TEM images of AB_18 and AB_14 cells and Mn oxides. (A) AB_18. (a) STEM high-angle annular dark-field (HAADF) image (the brighter areas indicate higher Z elements); (b) TEM image of Mn oxide minerals surrounding some cells; (c) TEM image of a cluster of minerals and their selected area diffraction patterns, showing some crystallinity (inset). (B) AB_14. TEM images with diffraction patterns (insets) of live and mostly dead bacteria with few obvious minerals around them (d) or aggregates of Mn oxide particles (e and f). Diffraction areas were larger than the images shown.

