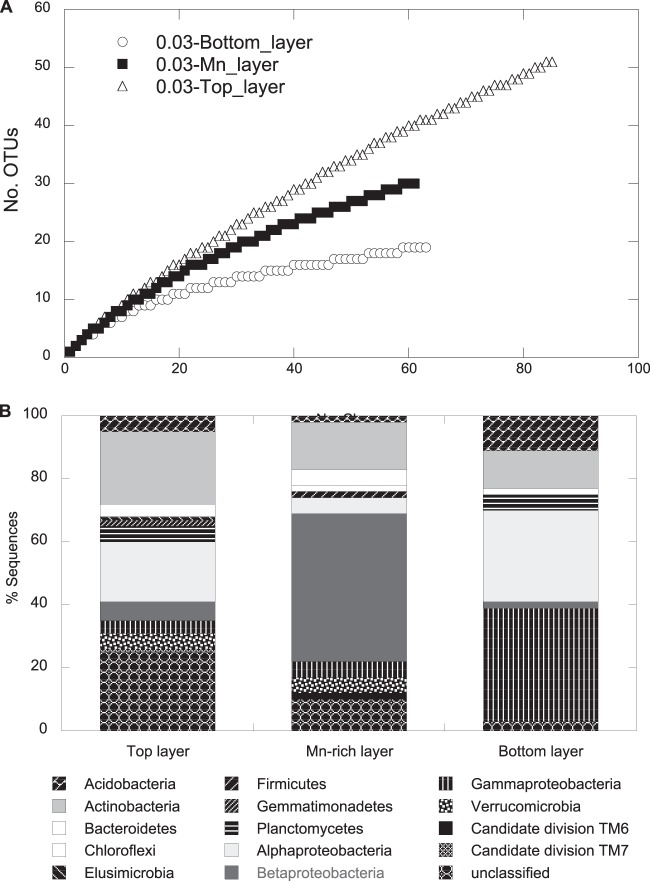
FIG 5.
Rarefaction curves (A) and frequencies of bacterial phylogenetic lineages (B) for the 16S rRNA gene clone libraries obtained for the three subsurface layers, Mn-rich, top, and bottom at the GTF site. A total of 85, 61, and 63 clones were analyzed for the top, Mn-rich, and bottom layers, respectively. Phylogenetic affiliations of OTUs (based on a >97% sequence similarity cutoff) were determined by using mothur against the SILVA database. Frequencies were based on the total number of clones associated with OTUs of sequenced representatives at the phylum level or class level for Proteobacteria.

