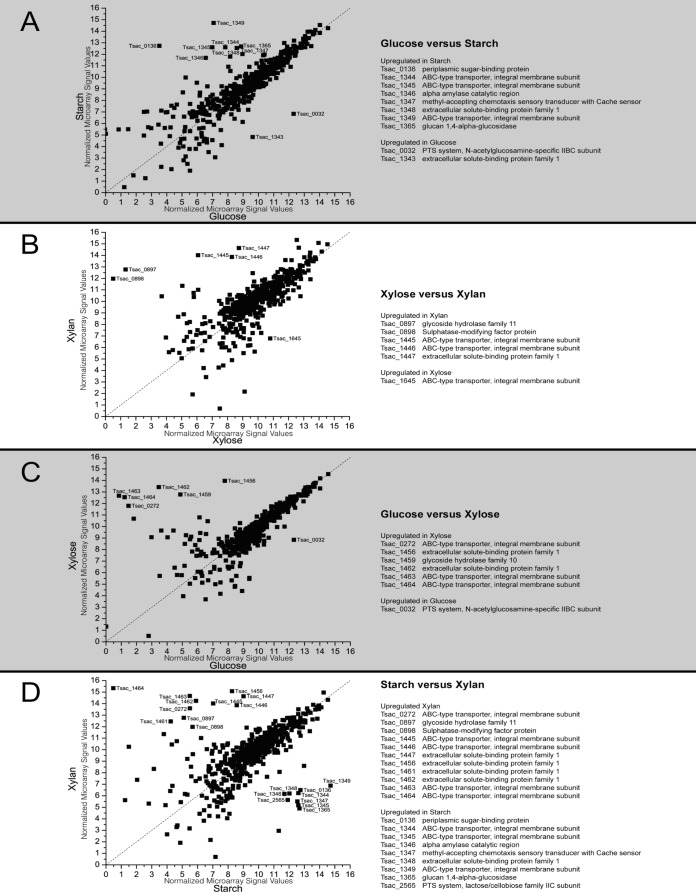
FIG 1.
Comparison of microarray results between different conditions during mid-log growth (log2 expression values) with strongly differentially expressed genes. The sugars studied were glucose (which has 6 carbons), starch (which is made up of glucose monomers), xylose (which has 5 carbons), and xylan (which is made up of xylose monomers). (A) Expression with growth on glucose at mid-log phase versus expression with growth on starch at mid-log phase; (B) expression with growth on xylose at mid-log phase versus expression with growth on xylan at mid-log phase; (C) expression with growth on glucose at mid-log phase versus expression with growth on xylose at mid-log phase; (D) expression with growth on starch at mid-log phase versus expression with growth on xylan at mid-log phase.

