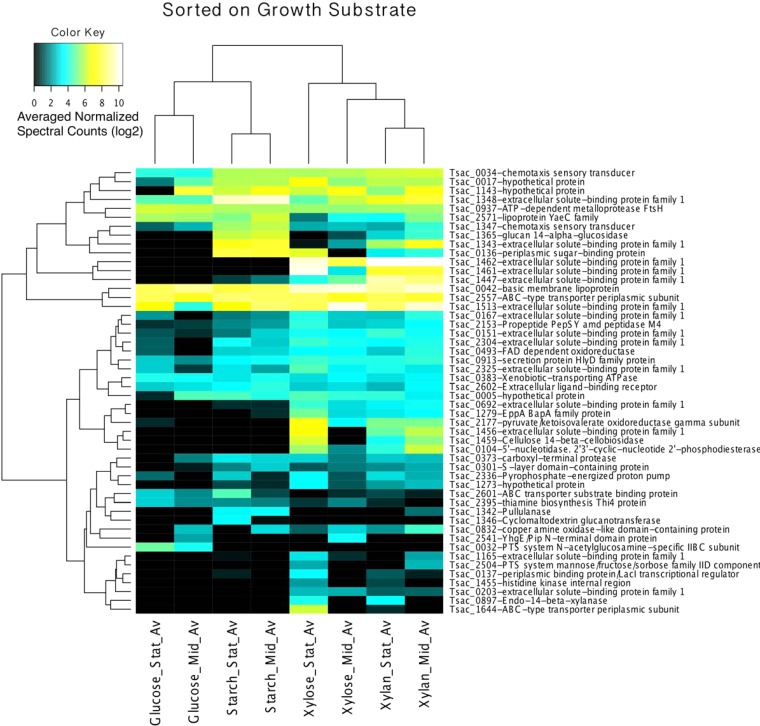
FIG 2.
Hierarchical clustered heat map of the genes for 50 proteins that contain transmembrane or Sec tag domains that were the most significantly expressed, as detected by LC-MS/MS. The data were normalized, and the results were analyzed by ANOVA, which was performed to determine differences in expression between growth substrates. FAD, flavin adenine dinucleotide; Stat_Av, average value for stationary-phase growth; Mid_Av, average value for mid-log-phase growth.

