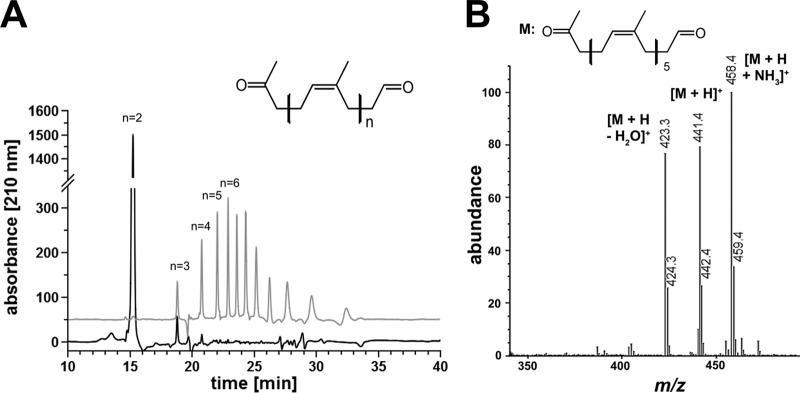
FIG 4.

Separation of RoxA and Lcp-derived polyisoprene cleavage products. Polyisoprene latex was cleaved by RoxA and Lcp (each 5 μg) for 2 h at room temperature. Cleavage products were extracted with ethyl acetate, dissolved in methanol, and separated on a reversed-phase C8 HPLC column. (A) A UV (210-nm) absorbance spectrum of RoxA products (black line) and of Lcp products (gray line) elevated artificially by 50 absorption units for better visibility is shown. Note that of at least 11 species of degradation products, the first 4 were identified by MS analysis. The peaks at 23.6 min or later did not give signals in ESI-MS analysis, probably because of poor ionization and/or poor acceleration. The figure generally shows difference spectra (spectrum in the presence of enzyme minus the spectrum of the same experiment without the added enzyme). (B) HPLC-MS of Lcp-derived polyisoprene cleavage products. A part of the mass spectrum of the 22.0 min peak is shown. The m/z values of prominent signals are assigned. The minor side peaks at m/z 424.3, 442.4, and 459.4 represent 13C isotope peaks.
