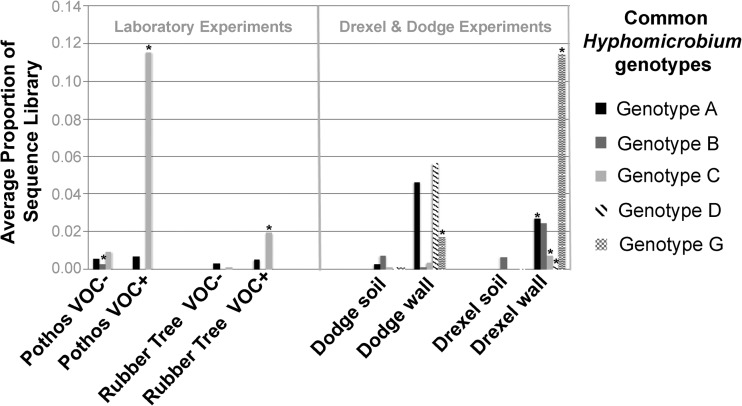
FIG 3.
Average relative abundance of Hyphomicrobium strains/genotypes across experiments. Values show the average proportion of the total number of quality reads made up by the named common genotypes (see Table S5 in the supplemental material for more details on each and for raw data on genotype abundance). *, means significantly different from those in the paired experimental treatment (i.e., wall- versus soil-grown plants or VOC+ versus VOC− plants). Note that in all but one case where the results were significantly different, Hyphomicrobium strains were more abundant under VOC exposure or biowall growth. Note also that different strains seemed to proliferate in different contexts.

