
FIG 6.
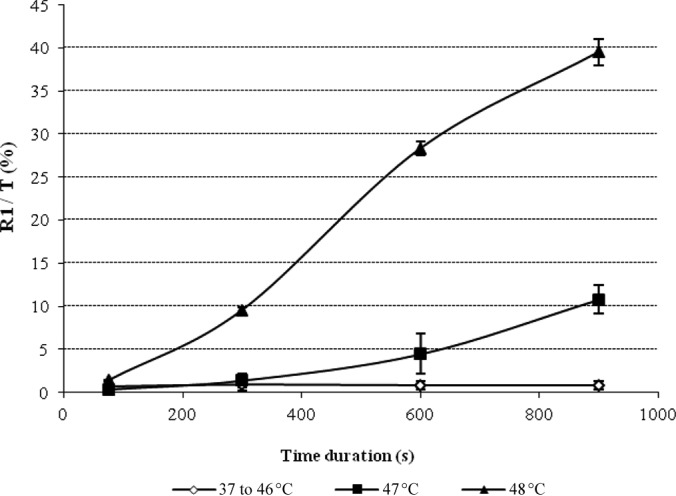
Effect of conventional heating at different temperatures on membrane permeability. Results are expressed as the evolution of R1/T = f(t) for different T (°C) values (where t is time). The curve named “37 to 46°C” corresponds to the average value of the results obtained at 37, 40, 42, 45, and 46°C, since percentages of highly stained cells were similar.